
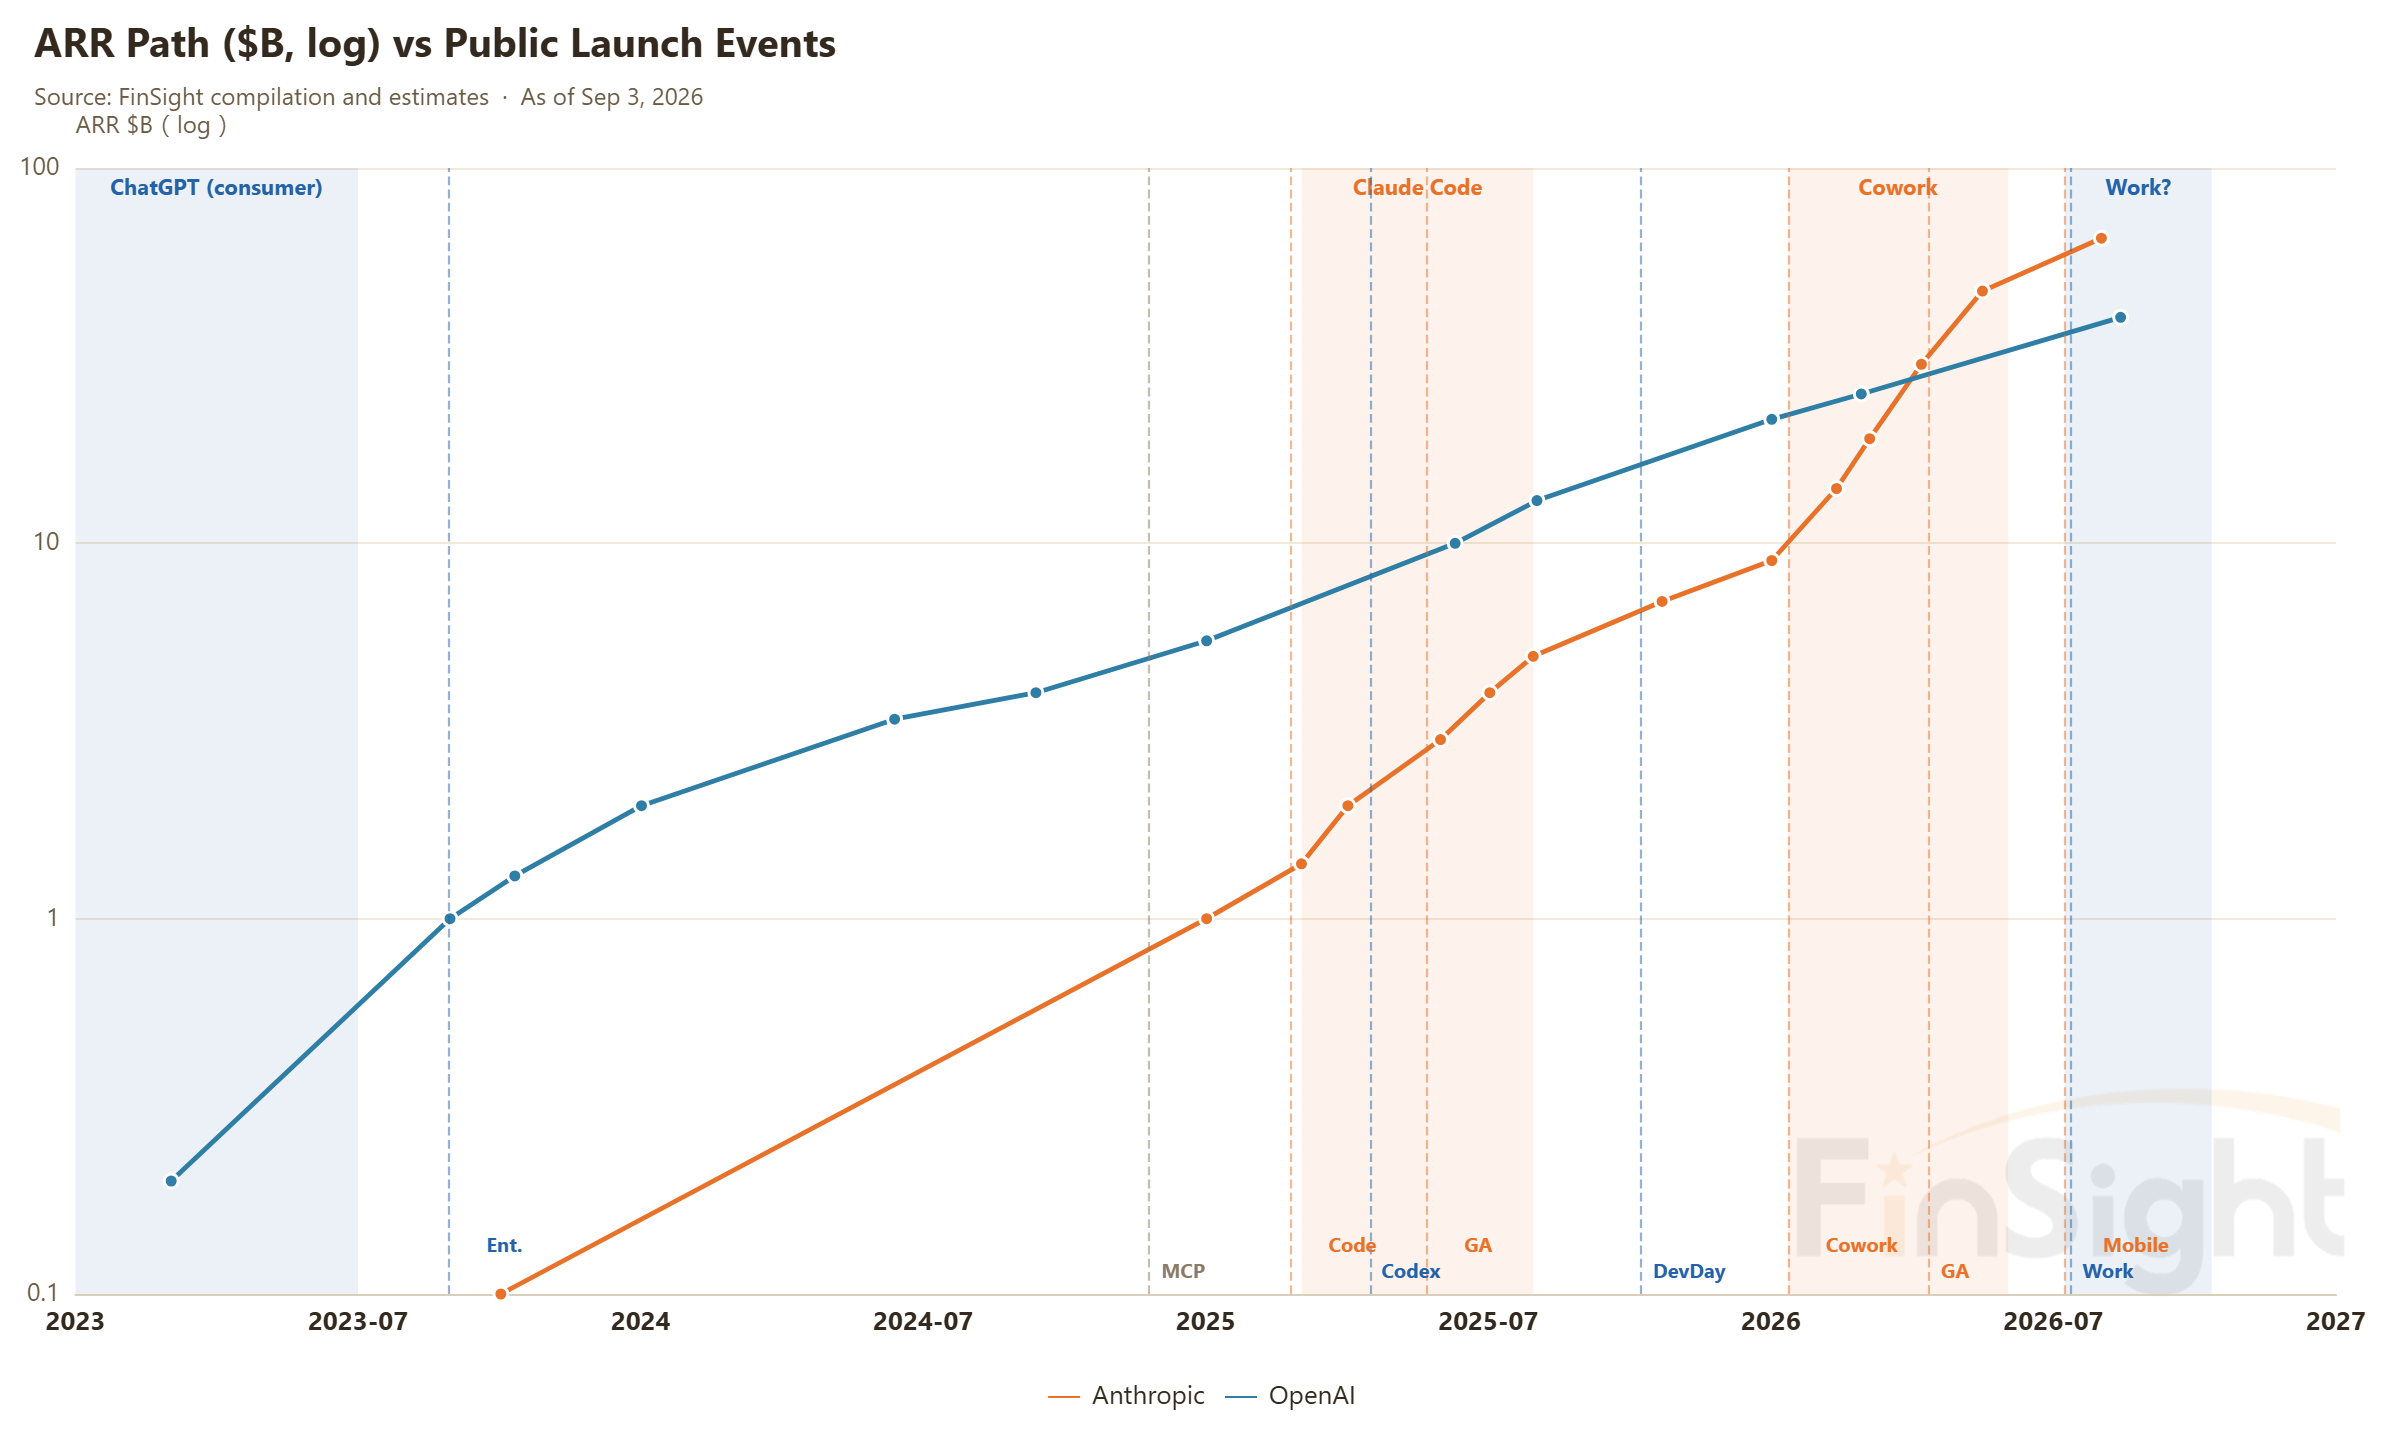
Four years of AI revenue show step-function growth in which every step follows a product launch, so a pause is not a peak.
Our last post made a simple point: the newest revenue numbers came in faster than what we penciled in back in July, so the new AI revenue data changes nothing about the compute crunch running into the second half of next year.
Key takeaways
- AI revenue grows in steps, not a straight line, and every step so far has landed on a product launch: ChatGPT, Claude Code, Cowork.
- The order never varies. Plumbing, then product, then usage, then breadth or depth, and the revenue print comes last.
- Claude Code was depth: paying-company share rose only about a point a month, while Anthropic's new ARR went from $0.08B to $1B a month.
- A pause is not a peak. It has topped out only if the product calendar goes blank, models stop improving and depth flattens.
But it left the more basic question open. A quarter like the second one, where revenue simply explodes, is not something you get every quarter. When growth does slow, how do you tell whether you are waiting for the next step up, or whether the thing has topped out?
So we went back through four years of AI revenue and pulled out the three fast-growth stretches, looking for a pattern: what drove each one, and which signals moved first on the way down. Get the pattern right and you know where to look the next time growth cools.
AI revenue grows in steps, and every step follows a product
Plot four years of OpenAI and Anthropic revenue on one chart, mark the big events on it, and one thing jumps out. Every time revenue steps up, it lands on a major product launch: ChatGPT, Claude Code, Cowork. The stretches with no new product are flat.
What actually drove revenue over these four years was one thing: whether some new product handed AI to a group of people who were not using it before. The model leaderboard and the compute supply had little to do with it.
The model is the engine. The product is the car. A stronger engine in the same car does not put more people in the seats.
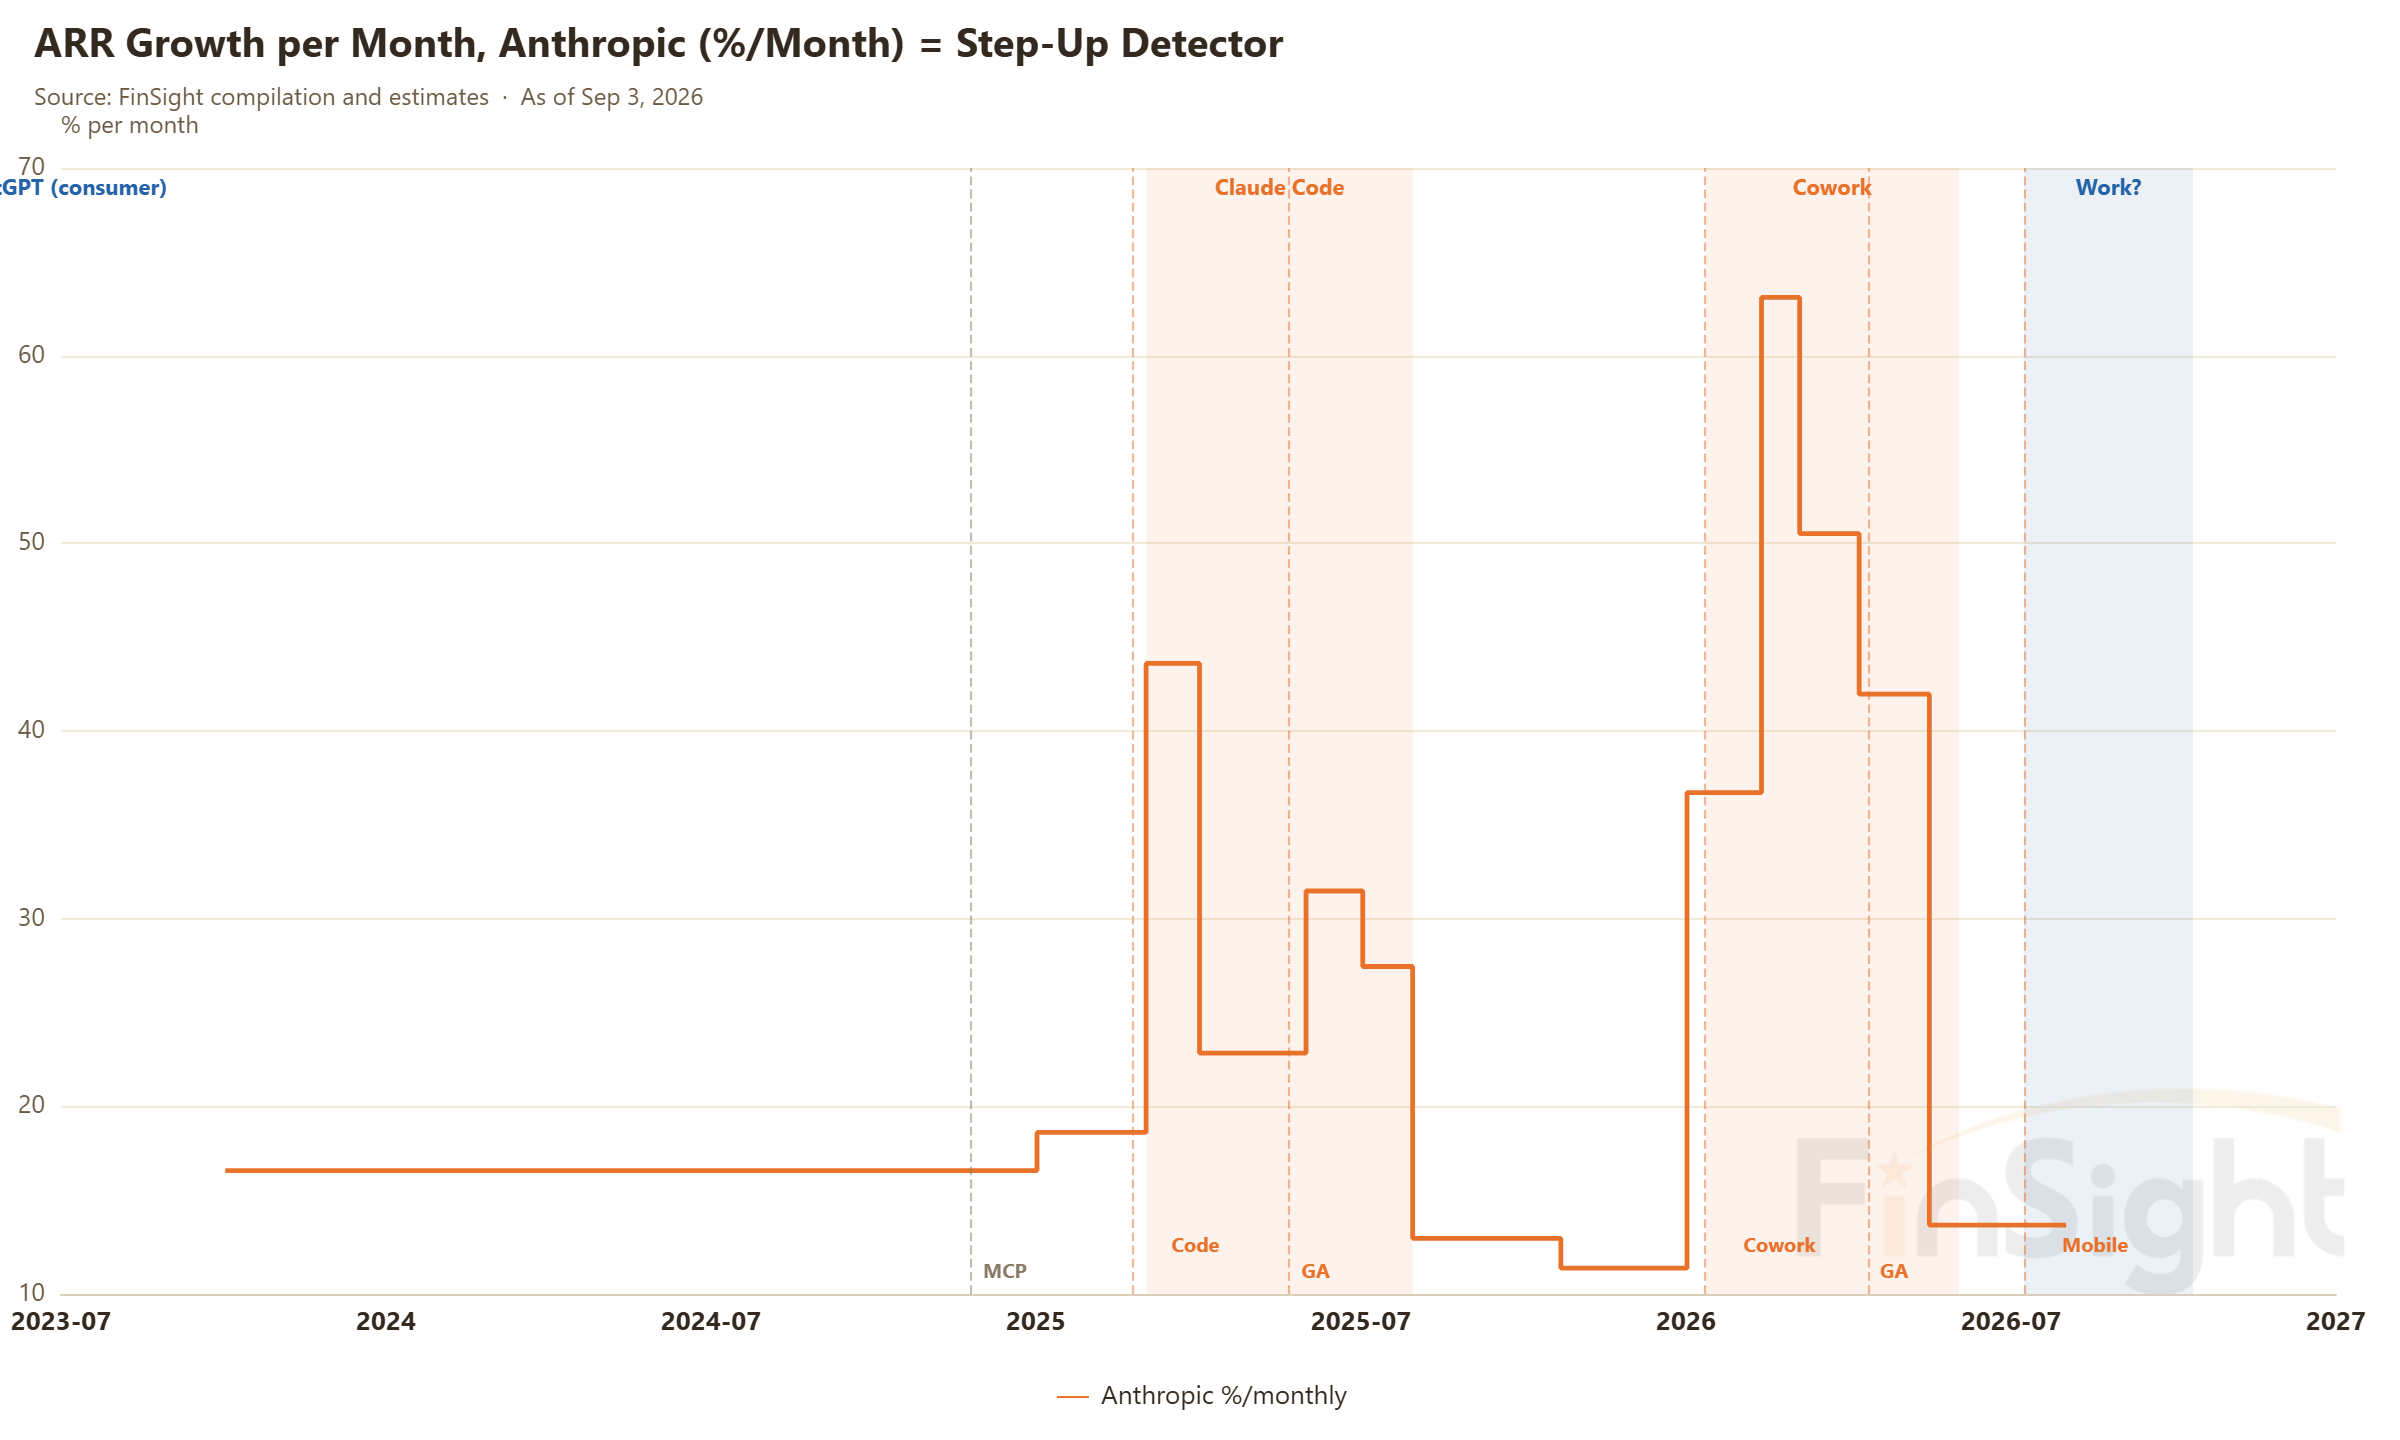
Switch the view to growth per month and the step function gets even clearer. Every time Anthropic ships a new product it holds high growth for roughly six months, then cools off. It is now back down to +14% a month.
OpenAI is the control group. After the consumer rush around ChatGPT faded, it ground along for two and a half years without a next step. In the first half of 2026 it stopped putting out numbers at all, and backing into it from what the company itself has said, this year's second quarter was the only time in its history growth actually shrank. It only started talking again after things turned in July. The dashed line on the chart covers late February to mid-August, when there were no disclosures at all and we backed the path out of company commentary. Read the direction, not the level.
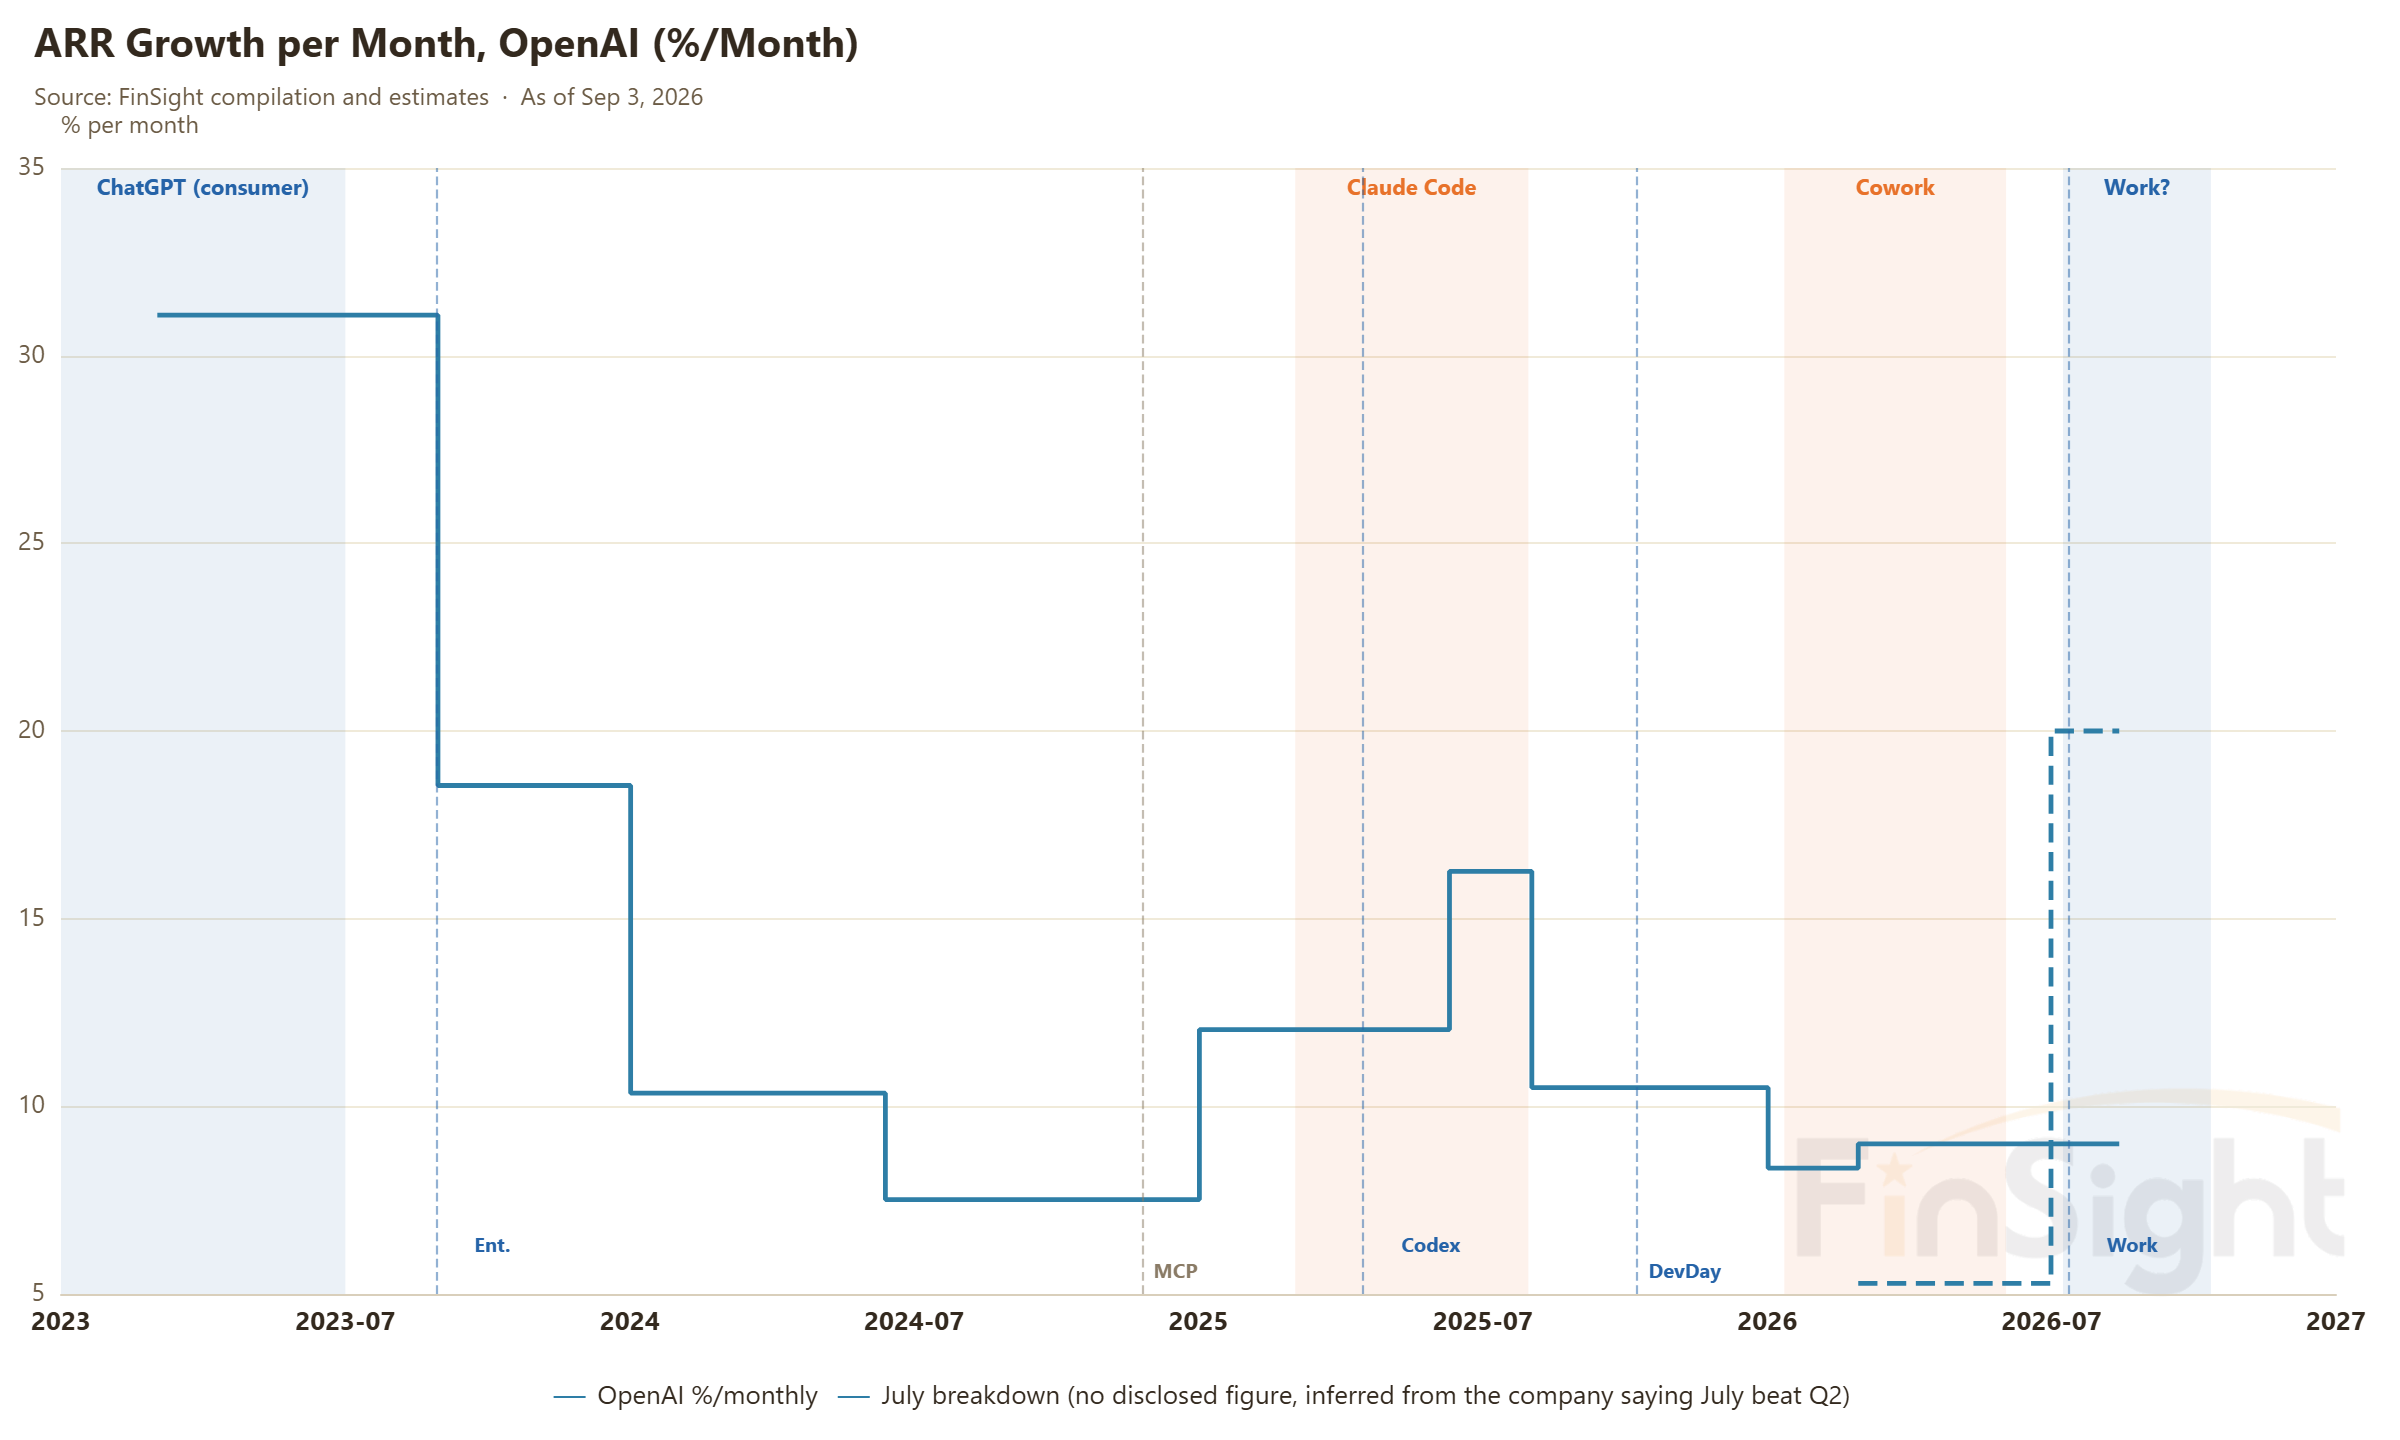
So why a step function instead of a line? Because growth comes one product at a time, handing AI to one group of people at a time. New products do not show up every month, so revenue does not climb at a constant rate every month either.
Think in straight lines and you get disappointed when growth slows, then startled when it jumps a step.
Knowing growth comes from products is not enough, though. You also have to know who is buying at each step and how, or you will not know where to look for the next one.
Three growth steps, and who pushed each one up
A company's reported revenue is one number. Ramp's corporate card data lets us take it apart, and it refreshes every month: out of a hundred US companies, how many are paying for AI (breadth), and how much the average company spends per employee per month (depth).
Revenue is breadth times depth. Lay those two lines over the product launch dates and the three stretches look nothing alike.
Step one: ChatGPT was breadth (Nov 2022 through 2023)
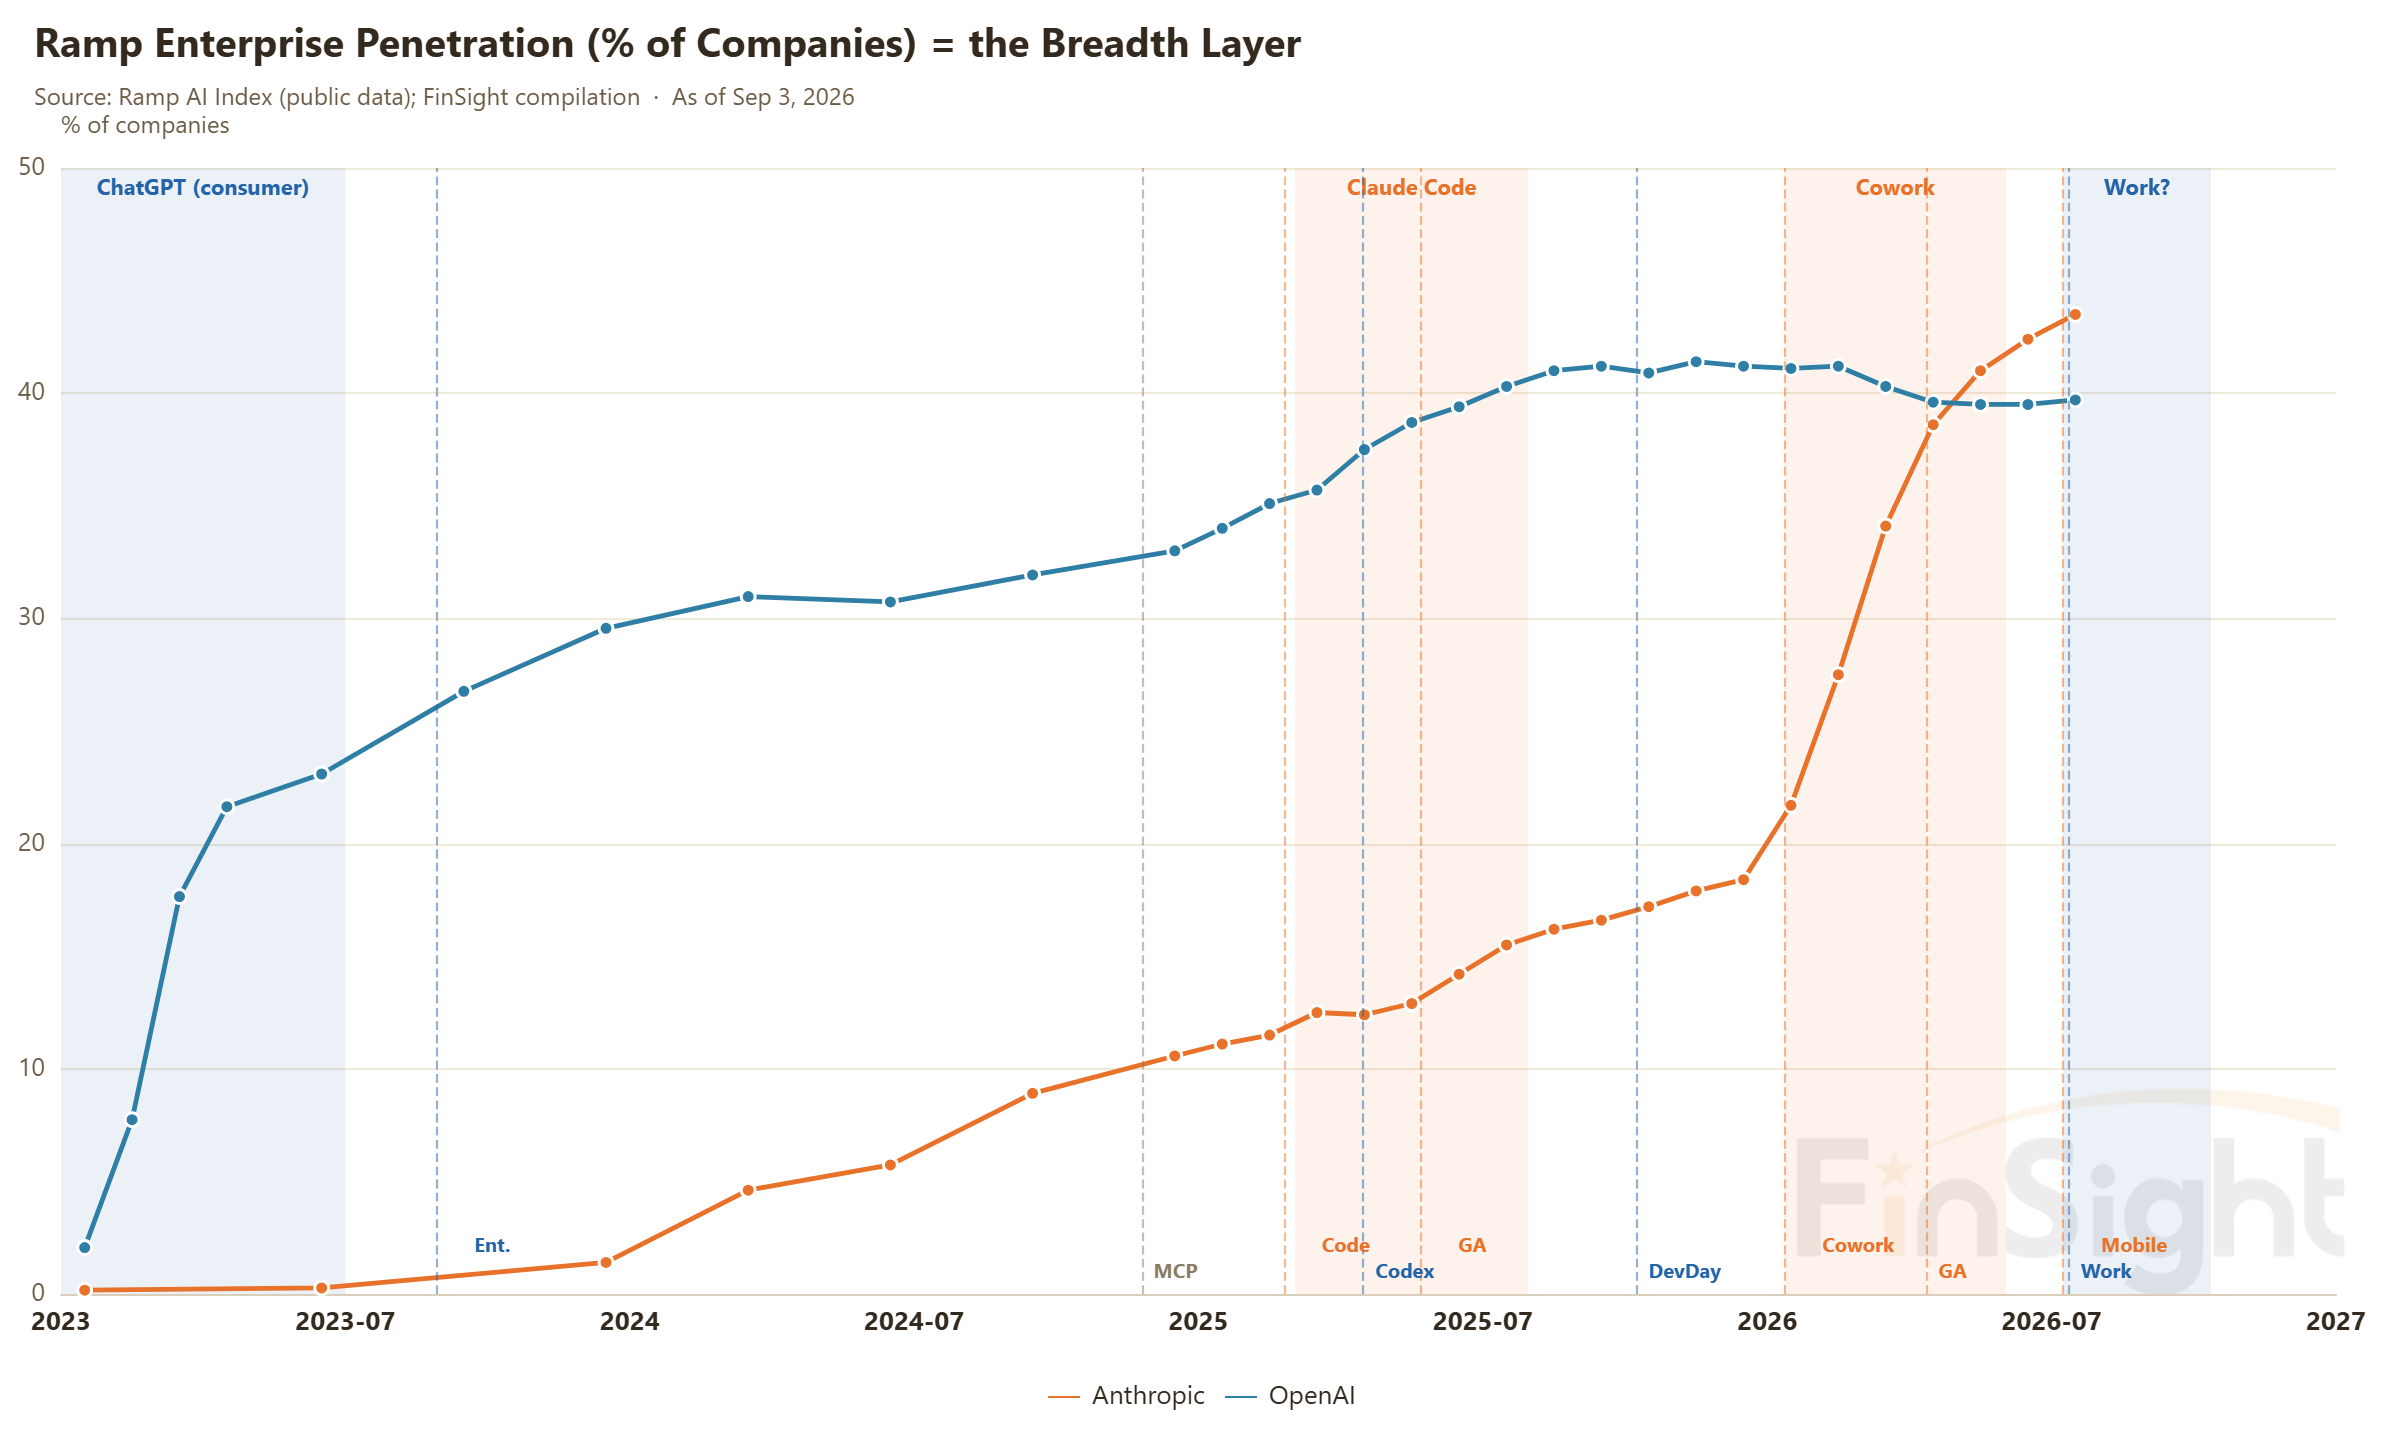
ChatGPT went live at the end of November 2022 and packaged AI as a chat box, a form anyone can use. It produced the largest burst of breadth we have on record: from January to March 2023, the share of companies paying OpenAI went from 2% to 18%, with a single month adding 10 percentage points.
But the money then was mostly individual subscriptions at $20 a month, a lot of people each paying a little. Once that wave passed came more than two years of slow climbing: paying companies added less than a point a month, and from mid-2023 to early 2025 OpenAI's ARR grew only $0.2B to $0.4B a month. The first time the market shouted that AI had topped out, the ROI panic of July 2024, happened inside that stretch. In hindsight, the product for the second step simply had not been built yet.
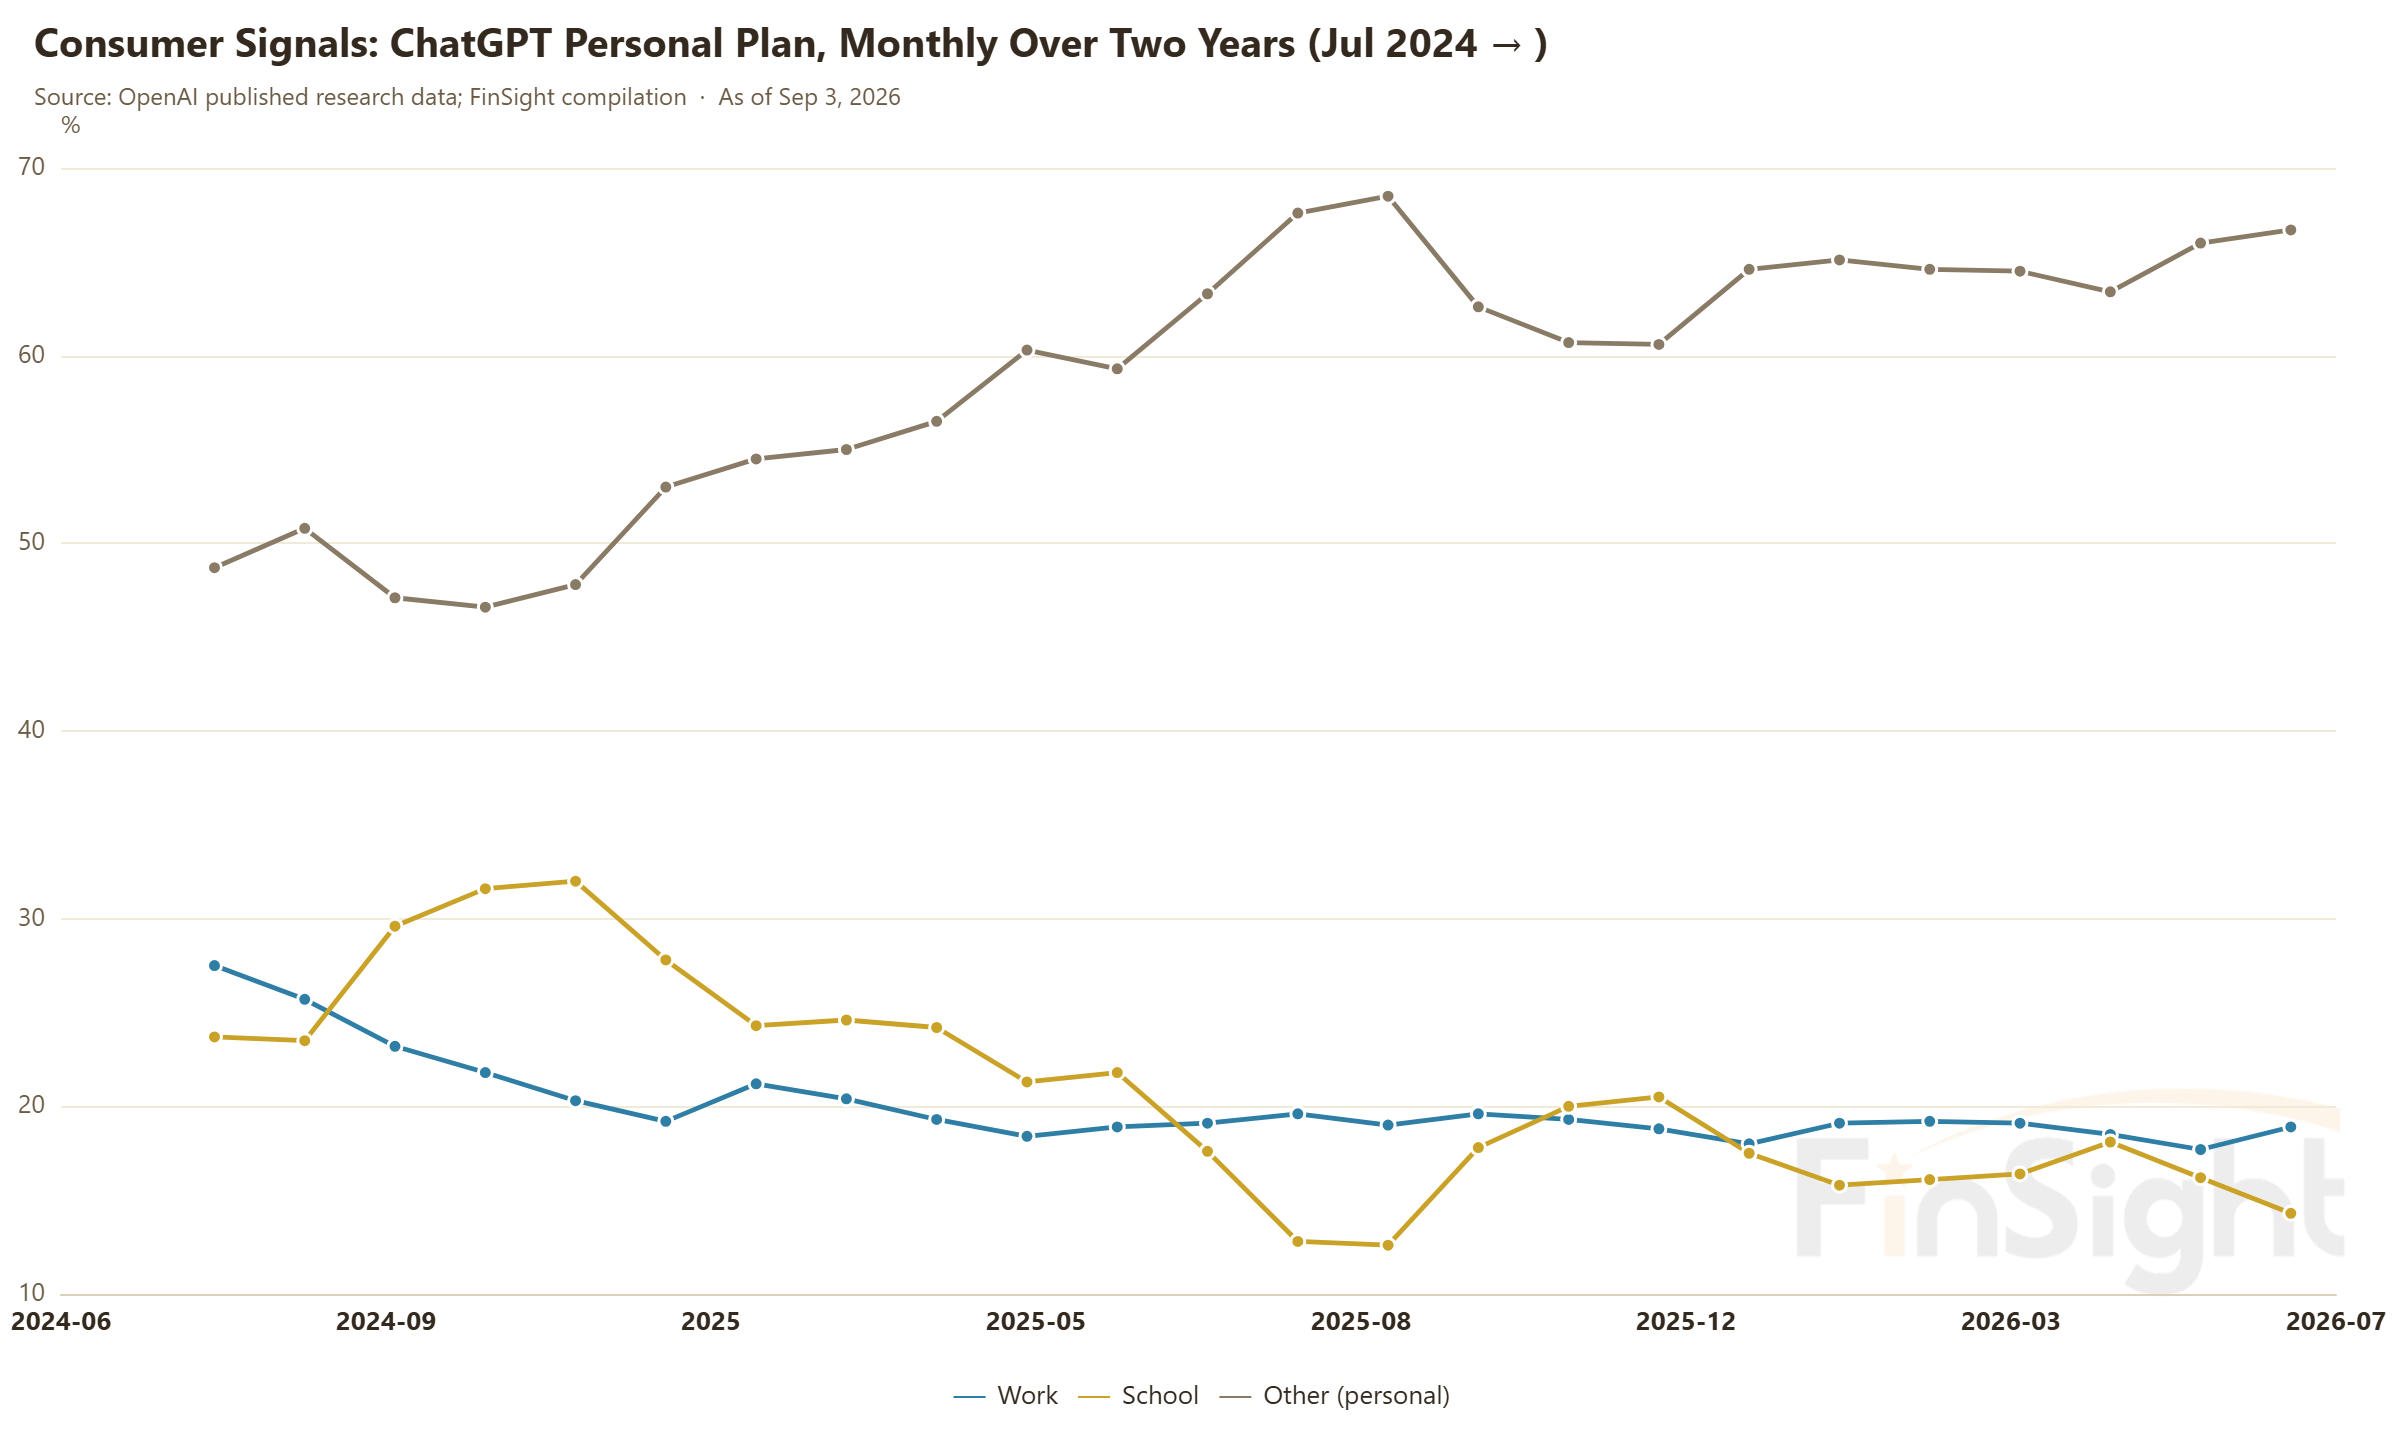
OpenAI's own usage data explains why the consumer side went flat. Look at what people have actually been doing with consumer ChatGPT over the past two years: work-related messages fell from 51% in July 2024 to 30%, and the share of messages that amount to asking ChatGPT to go do something fell from 52% to 45%.
People kept using it. The flood of free users mostly came to ask questions and chat, so the consumer product drifted toward being a Q&A tool. The demand to actually hand a job to AI moved to the enterprise instead.
Step two: Claude Code went deep inside one job function (Feb to Aug 2025)
This step starts with the plumbing. At the end of November 2024, Anthropic open-sourced MCP, a common spec that lets an AI assistant plug into a company's internal systems. Without that shared interface and permission model, an assistant could not get inside a company's systems at all. Everything that followed depended on it.
Three months after that plumbing went in, Claude Code shipped in preview in February 2025 and went GA in May, opening up engineers as a customer base. Anthropic's new ARR per month went from $0.08B in 2024 to $1B by the second quarter of 2025. We wrote our post on the B2B adoption curve in July 2025, right at that moment, and liked the strategy of staying focused on the API and leaving applications to the ecosystem. Our call then was that revenue had a shot at catching OpenAI within two years. It took less time than we thought.
But go back to the Ramp penetration chart. From March to July 2025, the share of companies paying Anthropic added only about a point a month, and Anthropic's paying-company line is nearly flat across the Claude Code band. New customers did not pour in. The money came from depth.
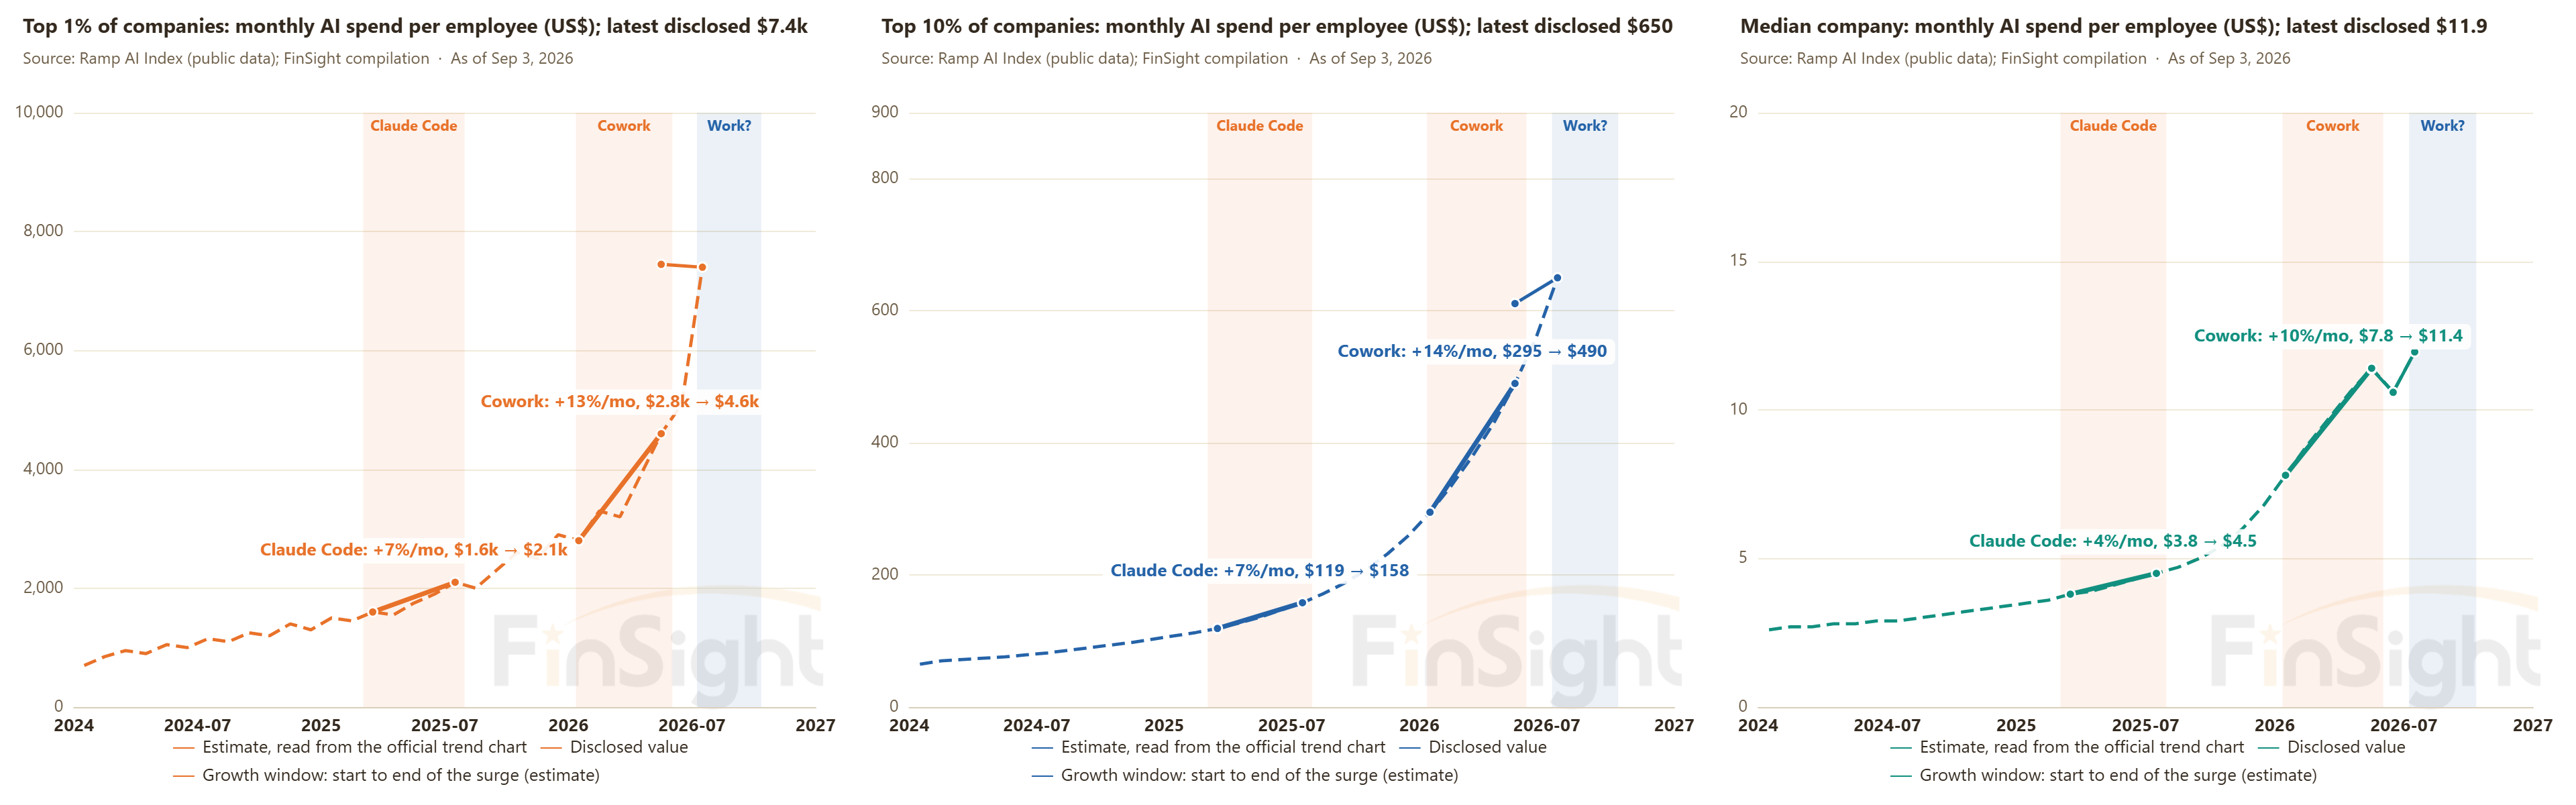
The next chart splits monthly spend per employee three ways: the top 1% of spenders, the top 10%, and the median company. Through the Claude Code stretch the top 1% and top 10% clearly move up while the median barely budges. That is what a handful of engineering teams using something very deeply looks like: not more companies, but the companies already on board spending more.
Step three: Cowork moved breadth and depth at once (Jan to Jul 2026)
Cowork launched in mid-January 2026, and this time what it opened up was the whole office.
Only engineers use Claude Code. Everyone who sits at a desk can use Cowork, so the addressable base multiplied. Companies paying Anthropic added 5.8 points in February and another 6.7 in March, 24 points over six months, and in May Anthropic passed OpenAI on company count. At the same time, spend growth in the top 1% and top 10% ran at twice the pace of the Claude Code period.
The obvious worry is that a rush of new customers drags down average spend per company. It did not happen, because what came in was an entire office, not a single seat. New ARR in this step peaked at $13.3B a month.
OpenAI took six months to catch up. We were negative on OpenAI through 2025 for exactly one reason: it was too weak in the enterprise. You could already see at DevDay in October 2025 that it intended to attack there, but the product was not good enough.
The turn came this year. In February, GPT-5.3 Codex flipped sentiment positive in the developer community and downloads started to accelerate. At the end of March, OpenAI killed Sora and concentrated resources. On July 9, ChatGPT Work launched, a new model and a new product on the same day, and the company said growth in July alone beat the entire second quarter.
Line the three stretches up and what you are looking at is AI moving into the enterprise.
- Step one: ChatGPT went for breadth, putting AI in front of everyone, but it stopped at asking questions.
- Step two: Claude Code went for depth, using AI very heavily inside one job function, engineering.
- Step three: Cowork and the agent products did both at once. Breadth widened from engineers to the whole office, and depth spread from one function to legal, sales and recruiting, with the gap opening up across every industry.
AI works its way into the enterprise a layer at a time, and each layer is another step.
The order in front of each step is always the same: first the plumbing (shared infrastructure like MCP), then a product, then usage rises, then paid company count or spend per head follows, and only at the end does it show up in a revenue announcement.
Ramp's data lands at roughly the same time as company disclosures. Its value is that it prints every month, and that it splits revenue into breadth and depth. When companies are not announcing revenue, we can keep tracking it and stay on top of what is happening in AI applications.
Breadth follows products, depth follows models
Which brings up the next question: does the next step have to wait for the next new product?
Not necessarily. There are two paths to growth: more companies start using it (breadth), or the companies already using it use it more deeply (depth).
Claude Code proved depth alone can carry a step. And there is far more room in depth now than there was then: the median company spends $12 per employee per month while the heaviest 1% spend $7,400, a 600x gap. Closing that does not require winning new customers. It happens inside the forty-plus percent of companies already paying, spreading from one seat to the whole company.
What decides whether it spreads is trust. Usage climbs only as fast as companies are willing to hand over permissions. Features get copied within six months. Trust, the internal data you have accumulated, and distribution do not.
The Claude Code step comes with a warning attached, though. Growth built on depth also ran about six months before cooling, no different from the other two. So saying watch depth is not enough. The question is what makes depth go up, and looking back at all three stretches, every jump in depth was preceded by models getting stronger.
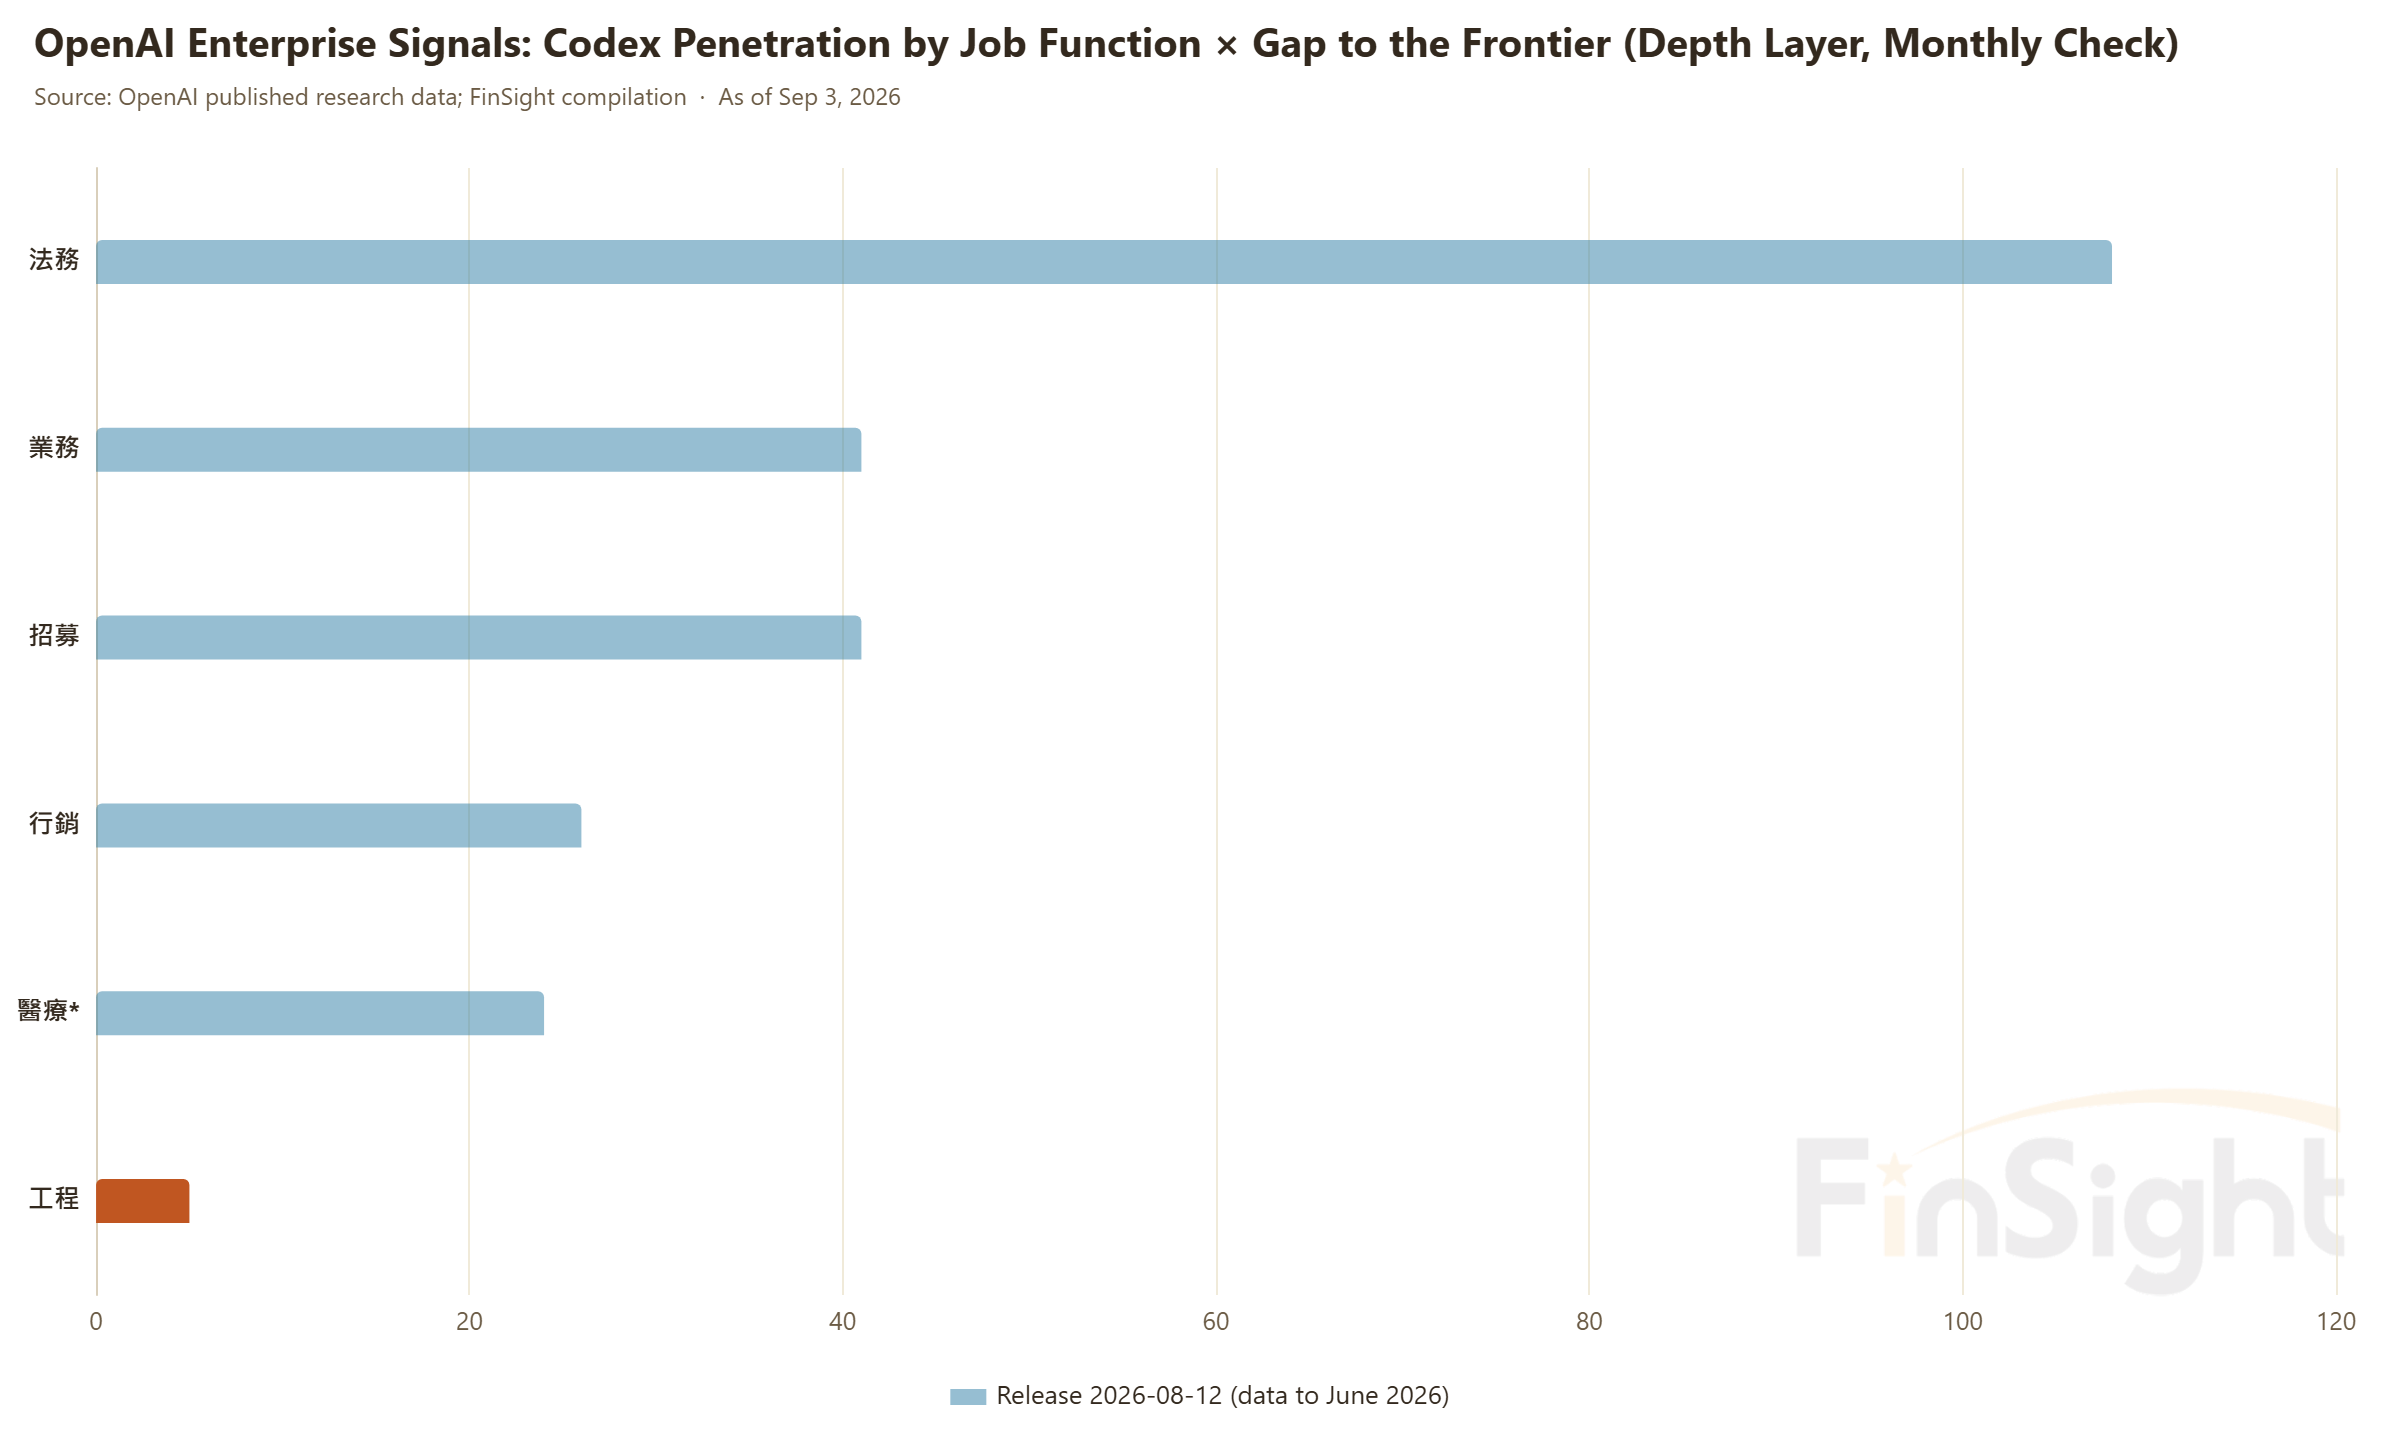
In August, OpenAI published enterprise usage data built from ten million de-identified enterprise messages, showing the growth multiple in Codex weekly active users by job function. From the launch of GPT-5.3 Codex in February through June: legal up 108x, sales and recruiting 41x, marketing 26x, and engineering only 5x.
Now look at the Ramp penetration chart over that same window. The share of companies paying OpenAI is nearly flat while Anthropic climbs the whole way. Put the two together and it is clear: OpenAI did not add new companies in this round. Inside the companies already using it, AI spread from the engineer's desk to legal, sales and recruiting, and what drove that was new models widening the set of tasks an agent can take on.
The widening in depth is measurable too. Comparing the companies using it most heavily against everyone else, tokens produced per active user went from a 2.6x gap in January to 8.3x in June, and 11.7x in information services. Agent mode, meaning Codex, went from 0 to 64% of enterprise output tokens between August 2025 and June 2026. The heavy users keep pulling away, and what is pulling them is the agent.
Anthropic shows the same thing. In July, spend in Ramp's top 1% rose 45% in a single month while the top 10% and the median did not move, timing that lines up with the Fable 5 launch. Ramp noted that Fable 5 accounts for only 6% of usage but 11.4% of dollars, and read that as poor reception plus enterprises hitting a spending ceiling. Our last post read it differently: Fable 5 is a more expensive new line, so few users paying more is exactly what it should look like, and the top 1% stepping up in July is the heaviest users paying for it first. On top of that, what Fable 5 mostly opens up is subscription upgrades from Pro to Max.
Going by the order in all three stretches, every step starts at the top and spreads toward the middle. So the top 1% adding spend looks more like the start of the depth path than a ceiling.
And why was the Cowork step the steepest of the three? Because the product opened breadth at the same time models were getting stronger. Two forces stacked.
That gives you what to watch when AI revenue growth slows: breadth tracks the product calendar, depth tracks models getting stronger, and depth is visible in Ramp's data every month. When growth cools, the thing to actually watch is whether depth keeps rising. As long as models keep letting AI do more, depth will move, and the plumbing for the next step is already going in.
It also sharpens the question our last post left open. In July only the top 1% stepped up. Will the middle follow over the next few months the way OpenAI's legal and sales functions did? If the September data shows the median company moving, the depth path is working across the whole market. If it does not, the next step may still have to wait for the next product.
Look at the last slowdown: the same panic, in 2H25
Test the framework on the last time growth slowed.
The Claude Code surge ended around the middle of 2025, and the second half was a quiet stretch with little news. Anthropic's growth clearly slowed, OpenAI was going nowhere and had not put out a number in a long time. The market's line then was word for word what it is now: growth is over, enterprises have used all the AI they are going to use. At the same time everyone was watching OpenAI sign big compute deals everywhere, and watching Oracle spend too hard to win them, with the worry that Oracle's balance sheet could not carry it.
Our call at the time was that applications would break out in 2026 and 2027. We wrote it up in June 2025 in our piece on whether AI CapEx made sense, and the reason was the earlier signals, all of which were moving. In this post's language: the breadth line was flat, but usage was exploding, models kept getting stronger, and agent products were queued up one after another. None of it had turned into announced revenue yet. Everyone has seen the answer since: Cowork launched in January 2026, the whole first half broke out, and Anthropic passed OpenAI in May.
So why did the vendors keep building data centers through that stretch? Because people learn the same fact at different times.
The companies know first, since they are the ones building Cowork and ChatGPT Work and can see agents already running inside enterprises. Then comes usage, with token consumption running a quarter ahead of revenue. Then paid company count and spend per head. The revenue announcement is a very late stop, and market sentiment is the last one. At the end of 2025 the market was panicking off the last stop while vendors were deciding off the first. That gap shows up every single time. And the market was not entirely without signals: as our last post laid out, revenue per chip bottomed at the end of 2025 and then ran from $1,318 to $2,430 by the middle of 2026.
Last time it worked out. The orders placed at the end of 2025 were fully absorbed by the first-half 2026 breakout, and by more than the people inside the industry expected.
But seeing it early does not mean seeing it right, and that is exactly how the 2000 telecom bubble happened. The carriers back then also held first-stop information, and they laid fiber as hard as they could against their own traffic forecasts and order backlogs. The famous line was that Internet traffic doubles every 100 days. The demand turned out to be real. It just arrived years late, and the people who spent all the money first were not around to see it.
So insiders still placing orders only proves the market panicked too early. It does not prove this round of investment is right. Our case that this growth is not finished has to come from the data itself, not from "vendors are building, so we should build too." The carriers had no scorecard to check this against. This time we do.
So when AI revenue growth slows, what do you look at?
Back to the question we opened with. Three stretches of history give the same answer: growth is a step function, and every step arrives in the same order. Plumbing first, then the product, then usage rises, then breadth or depth follows, and the revenue announcement comes last.
There will be another quiet stretch, and we may be in one now. When it comes, do not just stare at the revenue print.
Watch two lines. For breadth, watch the product launches: is there a next product that hands AI to a new group of people? For depth, watch whether models keep getting stronger, whether heavy users keep adding spend, and whether the middle of the pack catches up. Then add the gauge from our last post, new ARR per new chip.
As long as those lines are still climbing, slowing down just means waiting for the next step up. Turn it around, though, and if the product calendar goes blank for a long stretch, models stop getting stronger, and depth flattens out, then it may really have topped out. If that happens, our view changes with it.