
Back into 2027 capex from supplier revenue and the AI bill comes to about $1.98T, of which the five hyperscalers owe roughly 60%, or $1.19T.
Memory has run hard this cycle. The 2027 revenue consensus for nine memory and storage makers is now up to $1.51T, close to double where it sat at the end of February. That has people worried. Back into 2027 capital spending from what the supply chain says it will sell, and what buyers need does not match what the market currently pencils in for CapEx at the five hyperscalers, meaning Microsoft, Alphabet, Amazon, Meta and Oracle. If it really does not match, the supply chain's numbers have to come down.
Key takeaways
- Back into 2027 capex from supplier revenue and the market-wide AI bill is about $1.98T, up 49% from $1.32T in 2026.
- The hyperscalers carry about 60% of it, measured 60% from the buyer side and 63% weighted from the shipment side, and drifting down.
- At 60% they owe about $1.19T against a $1.10T consensus, roughly 8% apart, the kind of gap quarterly upward revisions absorb.
- The fight is over the share, not the total. Assume 80% and the hole is terrifying; assume 60% and the books balance.
The arithmetic behind the worry runs roughly like this. Start from the roughly $0.8T of hyperscaler CapEx estimated for this year, add what next year's memory prices cost, layer on chip volume and price growth, and you get the hyperscalers spending $1.3T to $1.5T in 2027, which is 20% to 40% above today's $1.10T hyperscaler CapEx consensus. Then stack on the market's other fear, that the hyperscalers cannot borrow enough to take CapEx much higher. Nobody can fill that hole, so the bear case ends in a big cut to supply chain earnings estimates.
The logic itself is right. Supply chain revenue is buyer spending, so in theory the two sets of estimates have to agree. The question is whether the calculation and the assumptions match reality. The number you compute has to land on the buyers who actually pay, or the exercise means nothing. And almost no supply chain company discloses its customer mix. Not one of them tells you what share of its revenue comes from the hyperscalers.
So when you back into the number from supply chain estimates, step one only gets you the market-wide bill. How much of that bill the hyperscalers owe is a share assumption, and that assumption is what decides whether you come out bullish or bearish.
This post runs the worry's own logic through the numbers. Size the bill first. Then measure who pays using actual 2026 data. Then put the two together against consensus and see whether the miss is really big enough to force supply chain estimates down.
Question one: how big is the bill? Build it from the supply chain's own revenue estimates
The bill has three pieces: memory, chips, and the facility itself. We size each one off what the supply chain says it will sell, then put all three on the same basis.
Piece one: memory, the biggest increment this cycle
We added up the analyst revenue consensus for nine memory and storage makers, the big ones being Samsung, SK Hynix, Micron, Kioxia, SanDisk, Seagate, Western Digital and Nanya. About $1.05T in 2026 going to about $1.51T in 2027 (compiled July 29, 2026; the 2027 consensus is up 94% from the end of February).
But a vendor's revenue is not the AI bill, so we made three adjustments.
- Samsung's memory share. Samsung's DS division was 61% of the company in 1Q26, and pure memory ran 52% to 55% of that. For the forward share we worked back from TrendForce's totals: DRAM plus NAND of $889B and $1,280B, and stripping the Chinese makers out of that total, Samsung's memory share is about 60%.
- The data center share. Micron's FY26 Q3 (the March to May quarter) had data center at 61% of revenue, Kioxia ran 56% to 60% (FY25, through March 2026), and Counterpoint's revenue-weighted read (DRAM at 65% on a two-thirds weight plus NAND's full-year average of about 50% on one-third) gets to about 60% for 2026 as a whole. We take 55% to 60% for 2026. There is no server-share reference for 2027, so we extrapolate off revenue growth and use 60% to 65%.
- Strip out the HBM the GPU makers already pay for. HBM is bundled into the price of NVIDIA and AMD GPUs and paid by the chip companies first, so leaving it in double-counts. Micron puts the 2027 HBM market a little above $100B, roughly a fifth of the AI memory dollars, and about 65% of that is paid by the GPU makers and has to come out. The rest, the ASIC camp's HBM, is bought by the hyperscalers themselves and needs no adjustment.
Run those three adjustments through and the memory bill buyers pay directly is $410B to $445B in 2026 and $660B to $720B in 2027. That is an increment of $250B to $275B, the largest single piece of added spend in the whole bill.
Piece two: chips
NVIDIA's revenue consensus goes from $376B in 2026 to $553B in 2027 (the company discloses data center at 92% of revenue), an increment of $177B. The HPC group, Broadcom and AMD and Marvell, goes from $220B to $325.5B, an increment of $105.5B. Assume the non-AI chip business is flat, meaning no growth in PC and phone silicon next year, and data center chip revenue adds about $282.5B in 2027.
One more line has to go in, the one that listed-analyst estimates miss: in-house ASICs plus China. Money going to domestic Chinese chips (Huawei Ascend, Cambricon and the rest) never flows through the US supply chain. Part of the hyperscalers' own silicon is also paid straight to foundry and packaging, with Amazon paying TSMC directly for Trainium and only a small design fee landing in Marvell's revenue. Google's TPU and Meta's MTIA mostly go through Broadcom and are already inside the HPC group, so we do not count them twice. Leave this line out and the supply-side denominator comes up short against the buyer side, which pushes the hyperscalers' share too high.
Piece three: the facility itself, meaning civil works, power gear and cooling
This one does not come from analyst revenue. We size it physically: roughly 30GW to 34GW of new data center capacity worldwide in 2027, at about $11B to $13B per GW. Against about $280B of facility spend in 2026, that puts the 2027 increment at $60B to $130B.
There is a force pushing the other way on cost, and it belongs on the record. SemiAnalysis recently pointed out that the industry is using prefabricated and modular construction to hold build costs down: about $13.5M per MW modular against roughly $14.6M the traditional way, a saving of about 8%, with schedules about 36% shorter at seven to nine months and on-site labor hours down more than 60%. They see modular penetration above 30% by the end of 2028. Components are getting more expensive even as a structural cost reduction runs through the facility side. That is one reason we use $11B to $13B per GW, and it is why cost per GW is worth checking every quarter.
Add the three pieces up
Put the three pieces on one consistent basis and you get the numbers below.
| 2026 | 2027 | Increment | How it is built | |
|---|---|---|---|---|
| Memory (paid directly by buyers) | $410B to $445B | $660B to $720B | +$250B to $275B | Nine-company revenue consensus, adjusted for Samsung's memory share, the data center share and HBM already paid by GPU makers |
| Chips (data center, increment) | NVDA $376B; HPC group $220B | NVDA $553B; HPC group $325.5B | +$282.5B | NVDA increment $177B plus HPC group increment $105.5B; non-AI chips held flat |
| Facilities | about $280B | $340B to $410B | +$60B to $130B | 30GW to 34GW of new capacity × $11B to $13B per GW |
| Market-wide AI bill | about $1.32T | about $1.98T | +49% | The yardstick used in the rest of the post |
Source: Supplier revenue consensus and company filings; FinSight compilation and estimates
One thing to be clear about: this figure near $2T is not us forecasting that everyone will in fact spend that much in 2027. It is a reading you get by measuring both years with the same yardstick. The yardstick has two uses. It gives you the growth rate, 49%. And it becomes the denominator in the next question, when we work out what share the hyperscalers carry. Is the yardstick any good? The next question answers that by opening the buyers' real wallets.
Question two: who pays for all this? The hyperscalers look like a bit over 60%
As noted, supply chain companies do not disclose their customer mix, so the supply chain only gets you a market-wide bill. But the market has never been arguing about the total. It argues about what share the hyperscalers actually owe. There is no ready answer, so we measure it three independent ways and see whether they converge.
Method one: the chip bill. NVIDIA breaks it out for us, and the rest gets sorted by hand
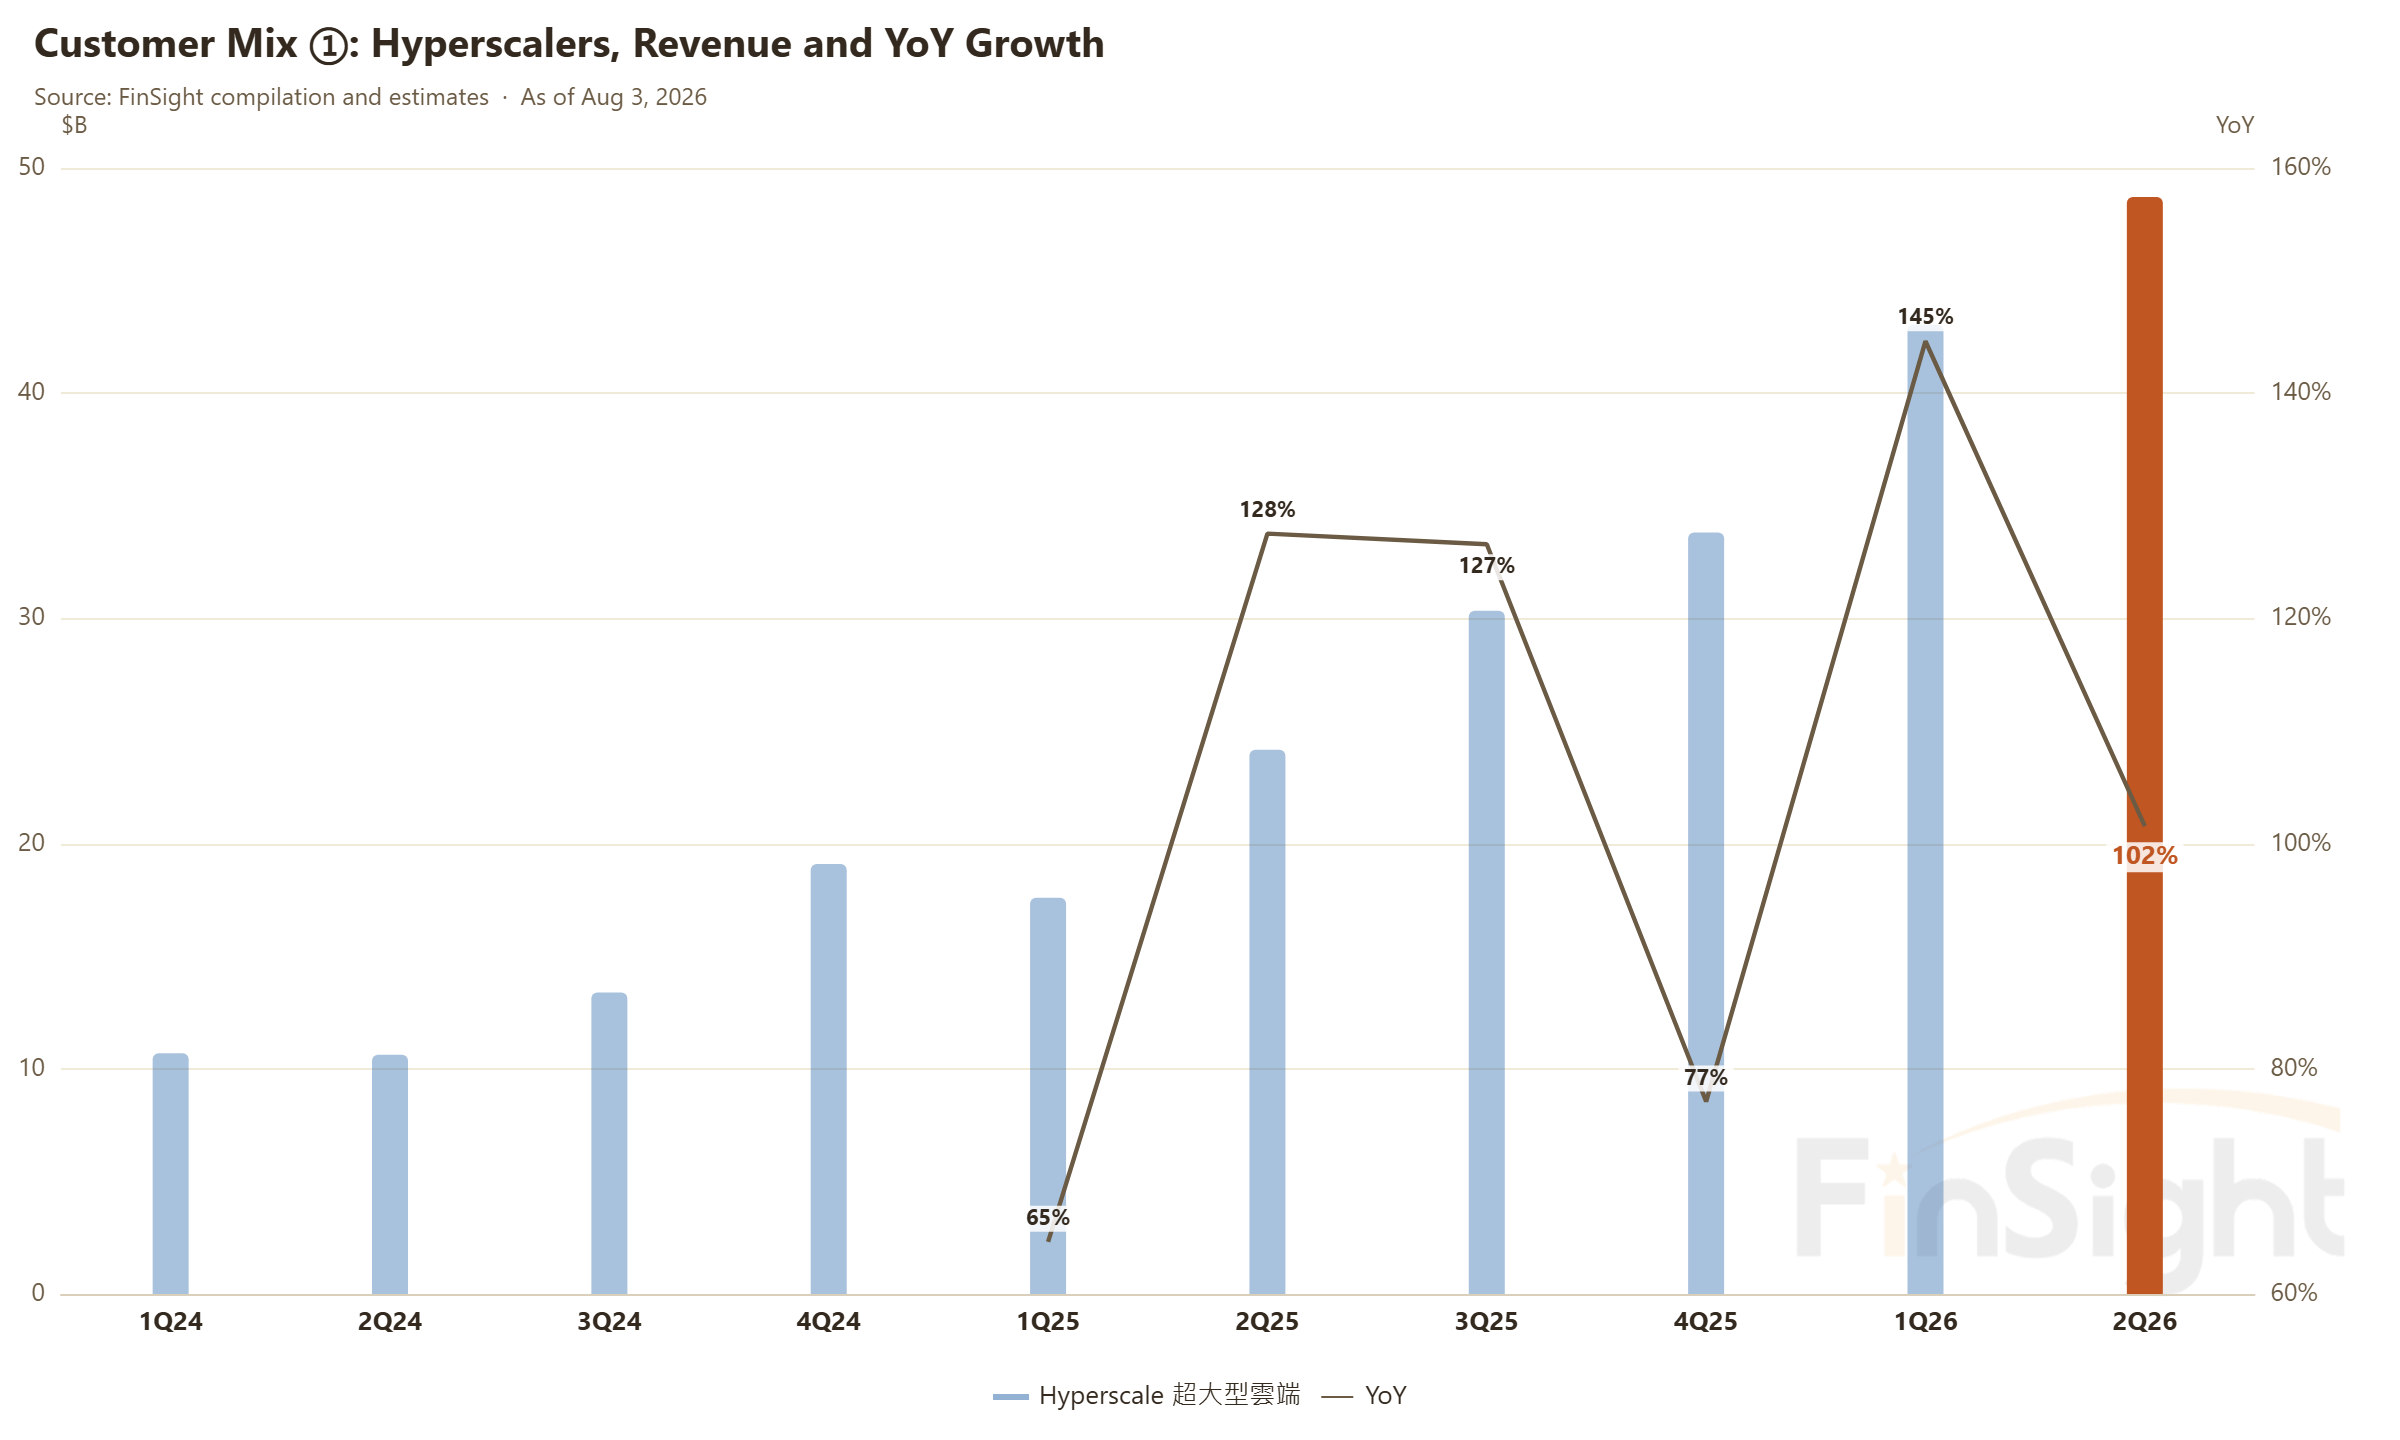
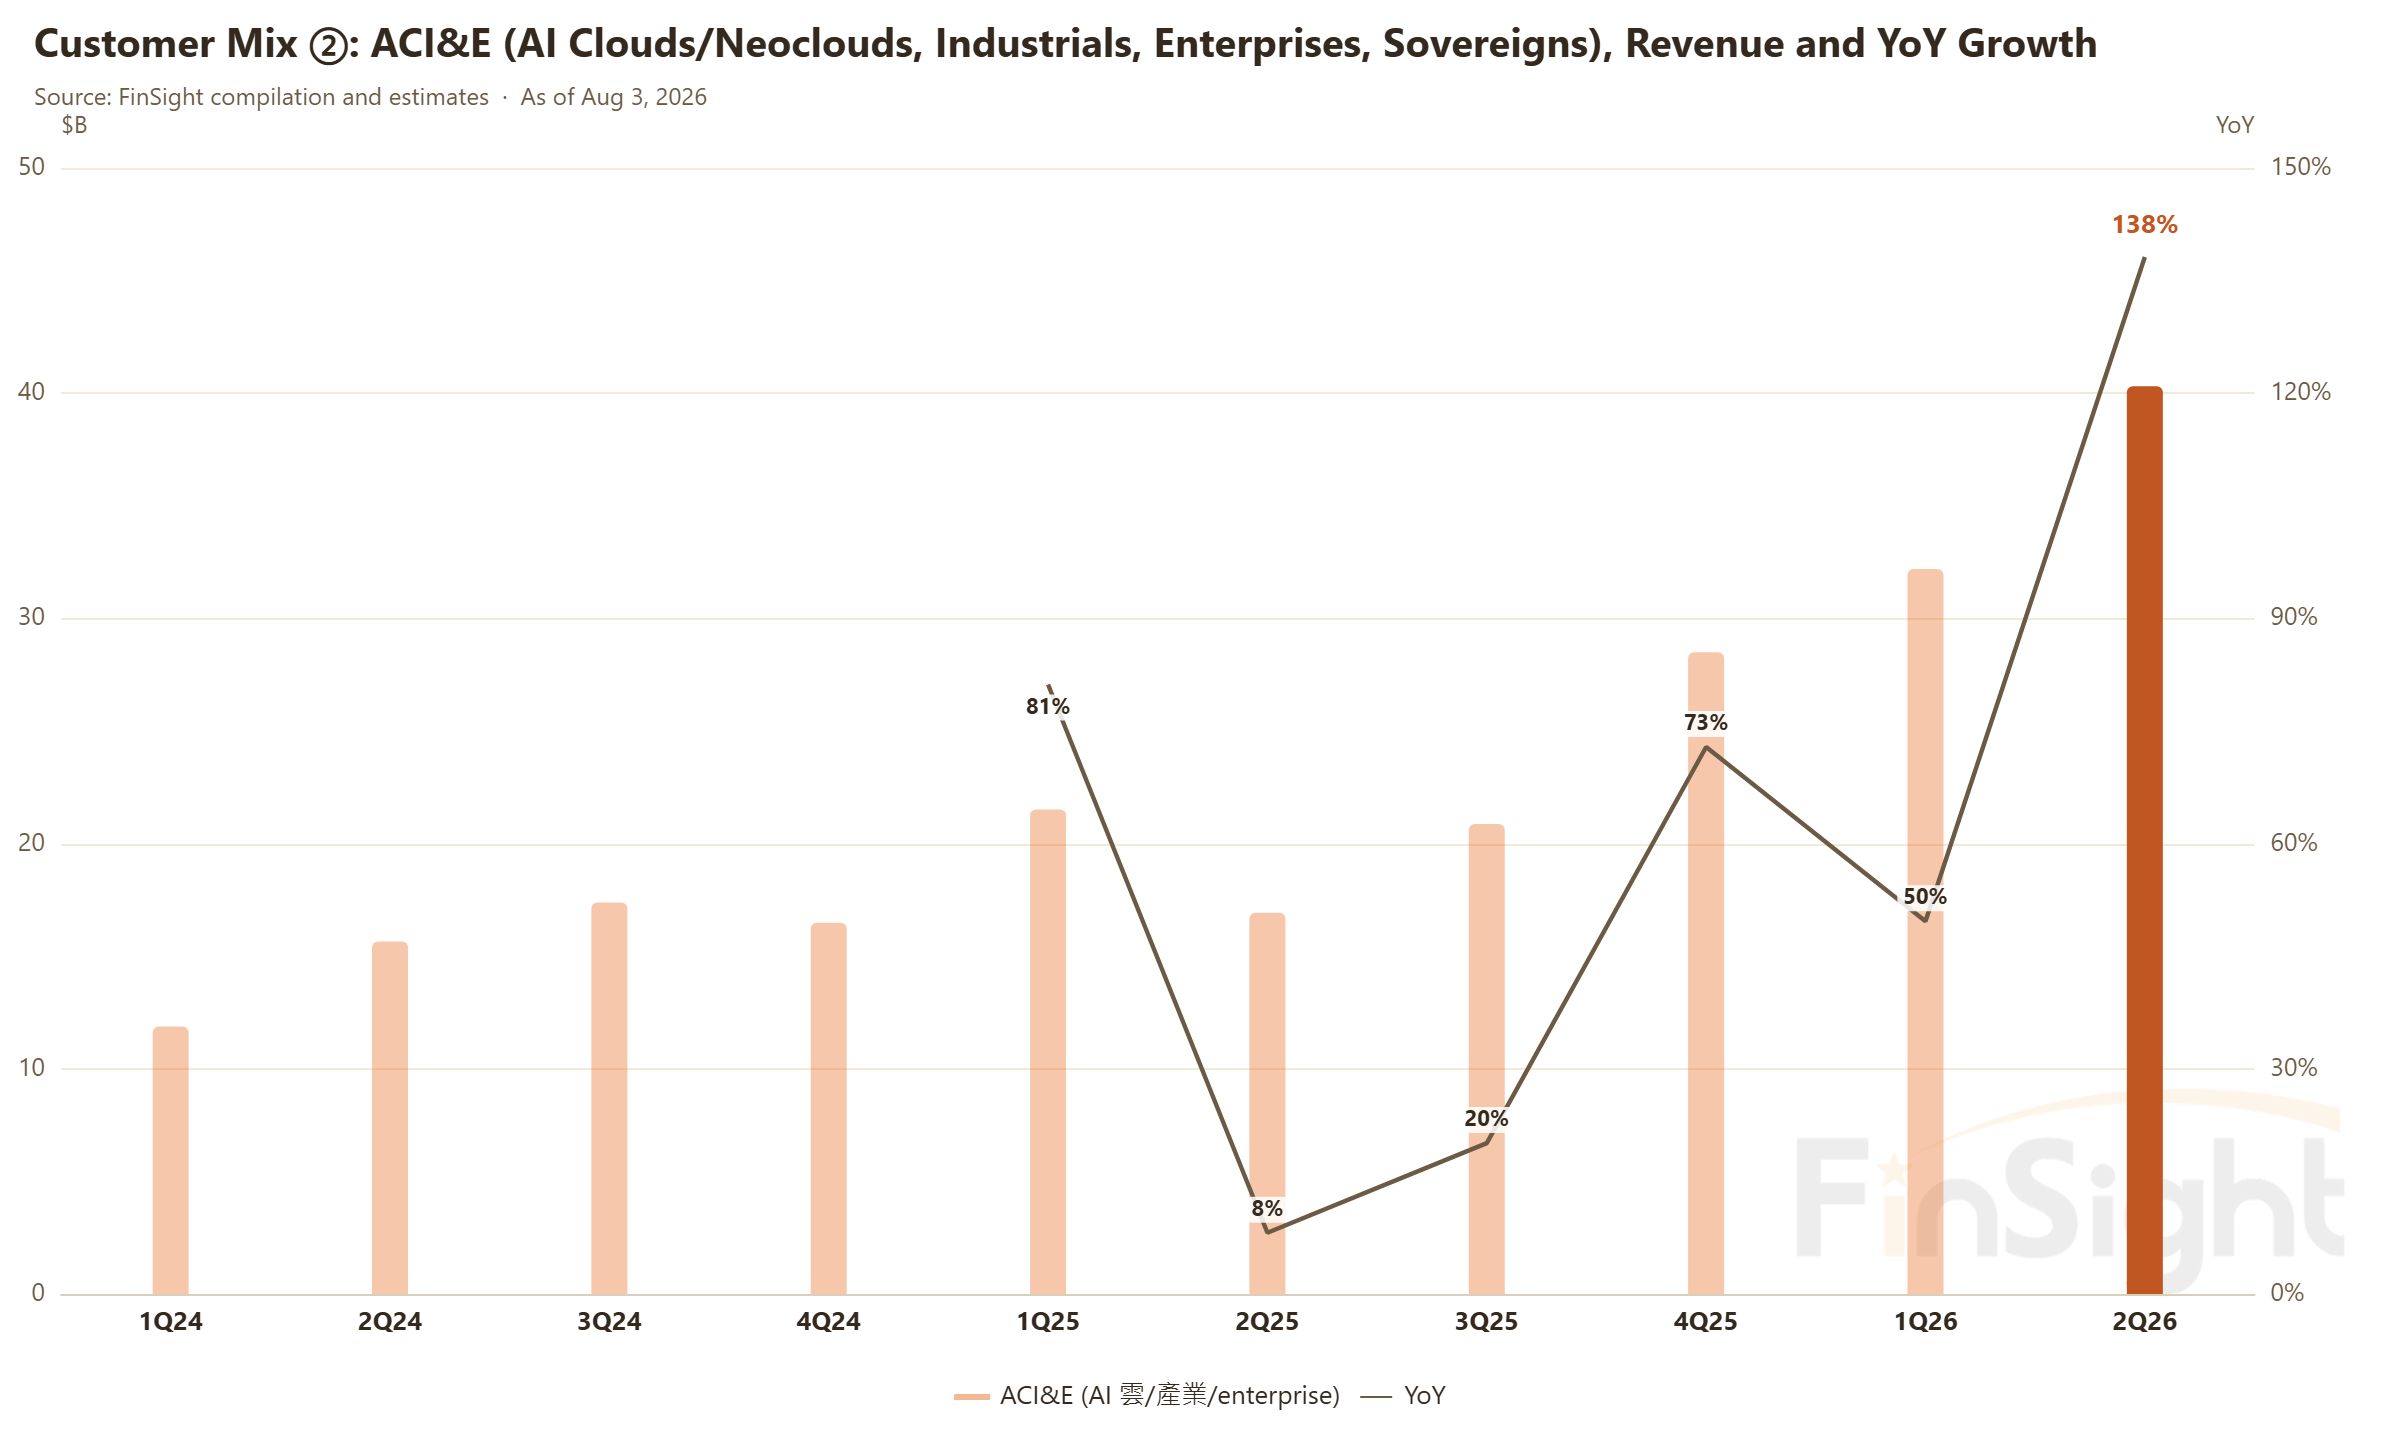
NVIDIA has disclosed its large cloud customer share for eight straight quarters, from the mid-40s up to a little over 50%. The latest quarter gives the number outright: Hyperscale at $37.9B (50.3%) against ACIE, the AI clouds, industrials and enterprises bucket, at $37.4B. That is close to a coin flip, and ACIE grew 31% sequentially while Hyperscale grew 12%. In our experience, when NVIDIA volunteers a new breakout it is telling the market this piece has the better growth. Add the shift toward open-weight models and you get a credible path where AI spend broadens well past the hyperscalers. In dollars: NVIDIA's data center revenue annualizes at roughly $300B, so from NVIDIA alone about $150B a year of the chip bill is paid by buyers outside the hyperscalers.
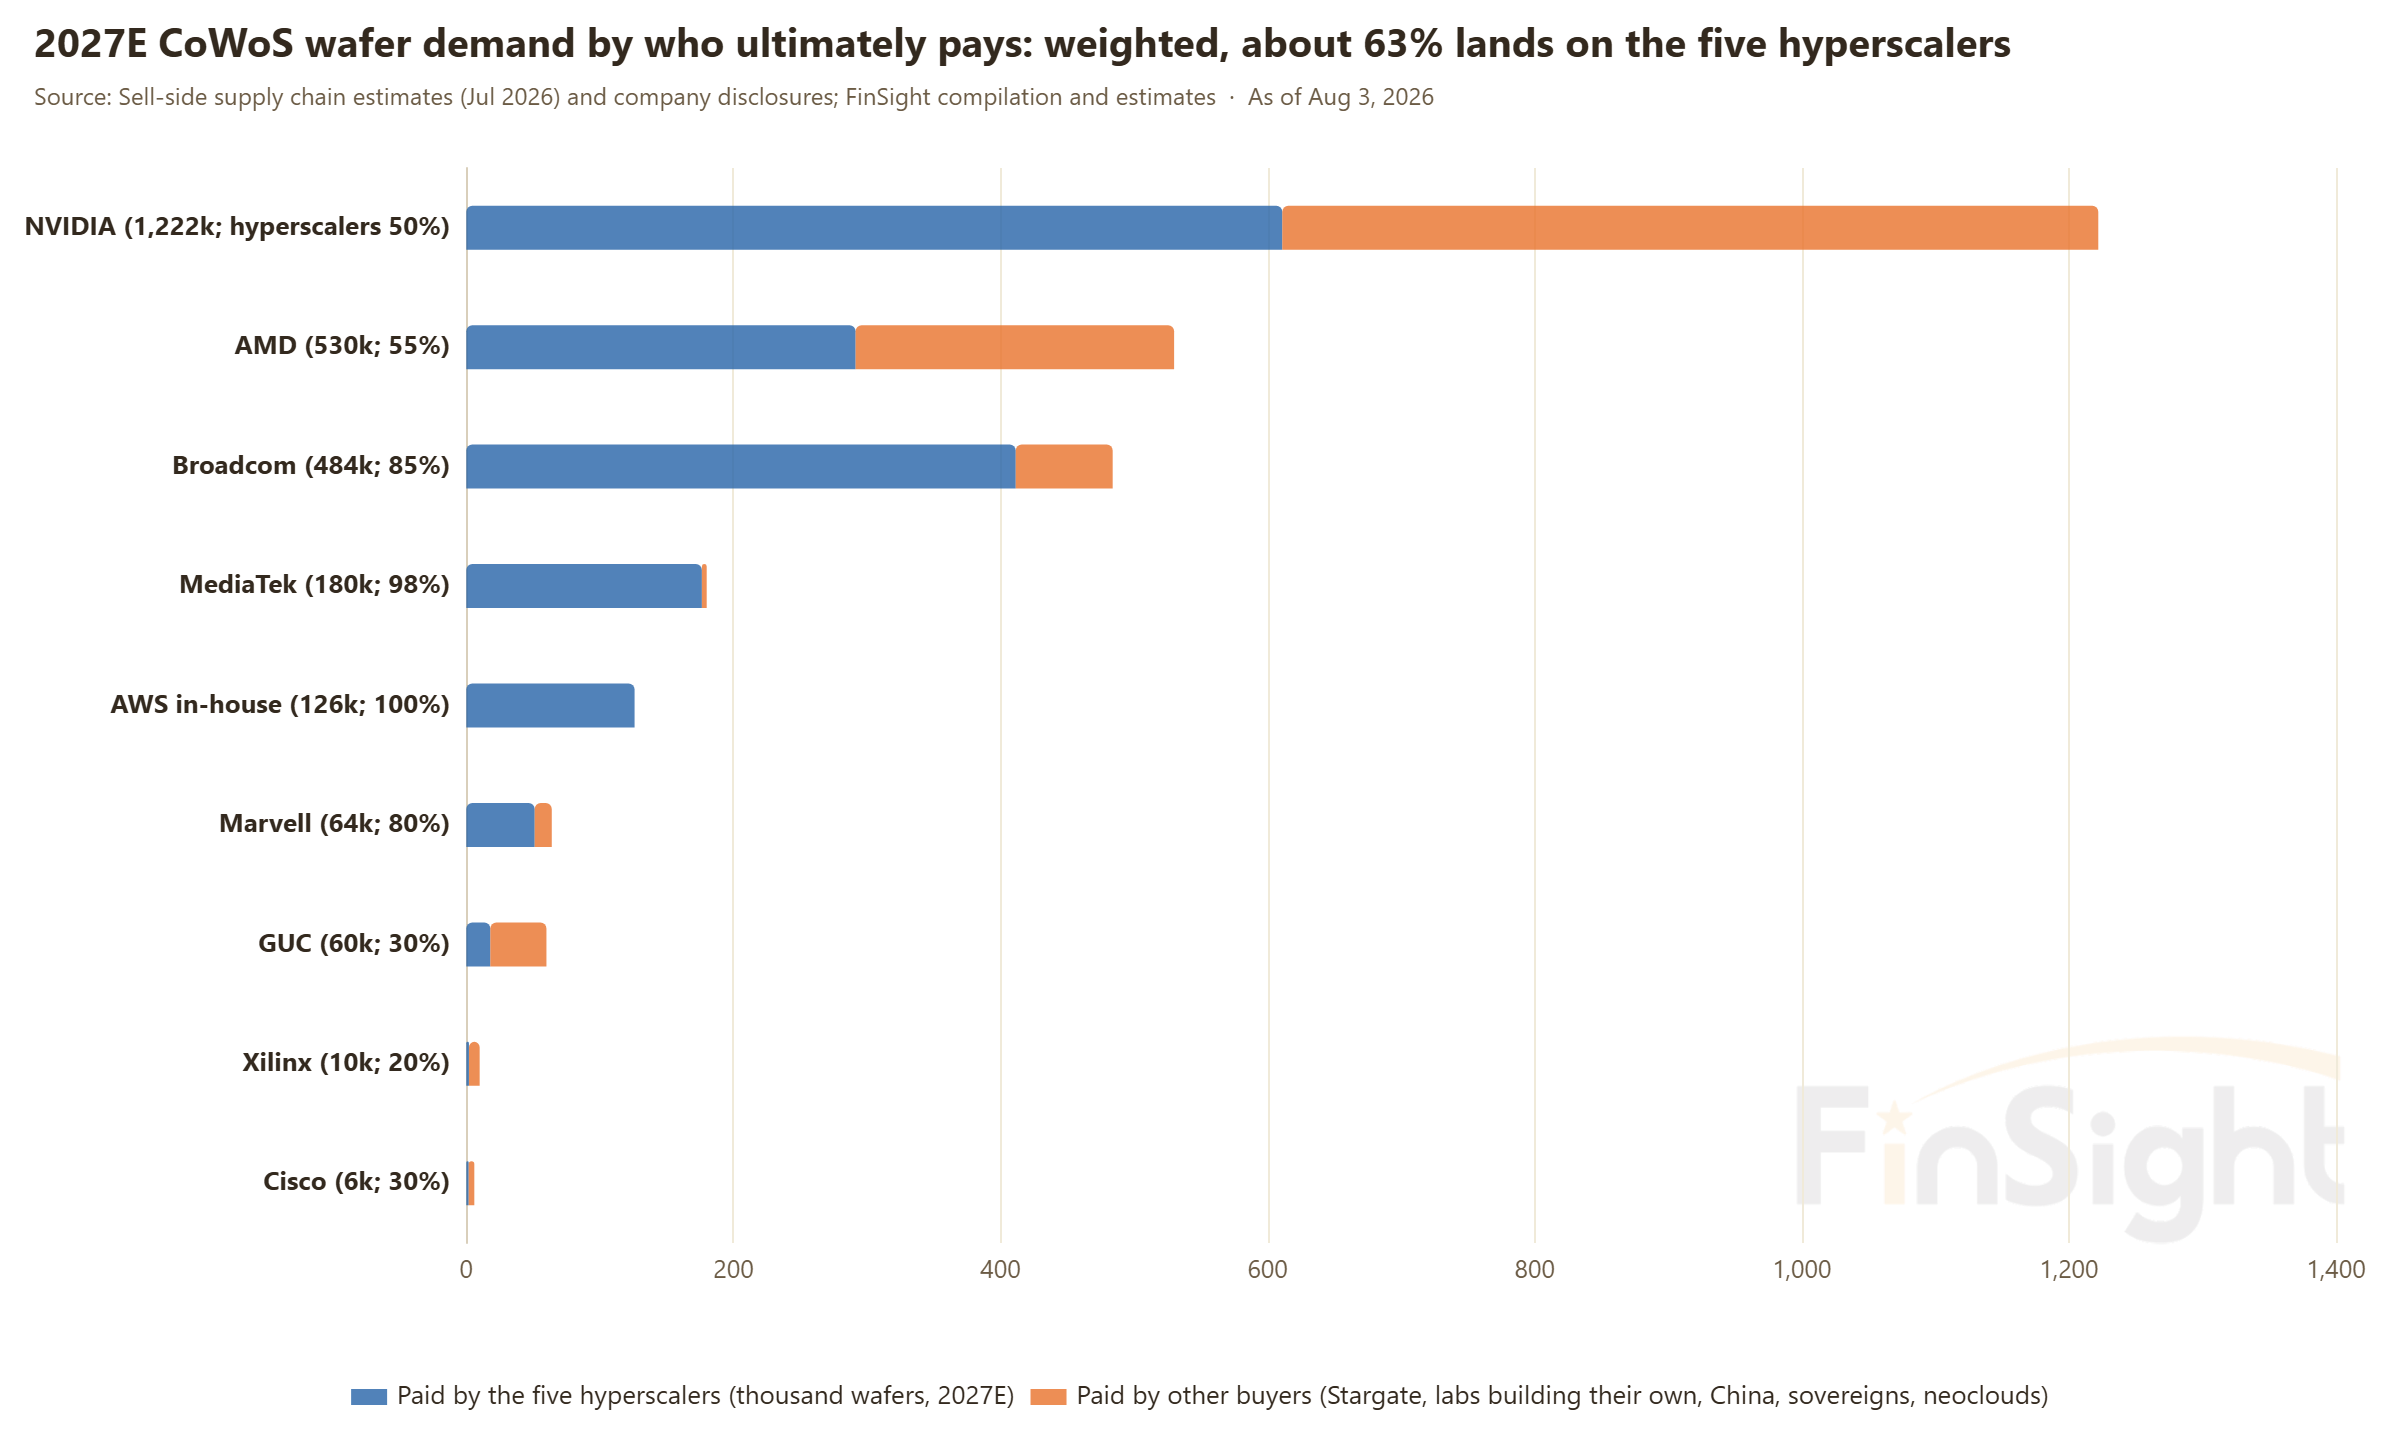
Chips outside NVIDIA cannot be read across. They have to be sorted company by company. We took 2027 CoWoS wafer estimates (from supply chain research, with wafer count up 94% from 2026) and each vendor's announced customer list, and sorted out who ultimately pays for each wafer. The ASIC camp skews to the hyperscalers by construction, since Google's TPU, Meta's MTIA and AWS's Trainium are all self-designed and self-funded, so we put Broadcom at about 85% on a 2027 shipment basis. OpenAI's 10GW lands in tranches from 2H26; Anthropic's 3.5GW starts in 2027 and contributes even less in year one; ASICs outside the hyperscalers do not scale until after 2028. Work off the future GW contracts already announced, which are paid for by XPV, a financing platform backed by Apollo and Blackstone, and the long-run number drifts toward about 60%. Add back the pieces that lean the other way, like AMD with OpenAI and GUC (Global Unichip, TSMC's design services affiliate) with China, and the whole thing weights out at about 63% of the chip bill paid by the hyperscalers, heading toward about 60% after 2027.
Method two: the satellite count. Where do the chips physically end up?
The last method counted dollars. This one counts physical capacity. Epoch tracks sites one at a time using satellite imagery plus document checks, 74 sites in all. The non-hyperscaler share of installed compute, meaning xAI, CoreWeave, China and the labs building their own, has climbed from roughly 20-23% in 2024 to about 27% today, and the completion schedule points to about 34% by the end of 2027. Everyone outside that group is growing faster than the hyperscalers are. Split it by annual additions and it is clearer still: the non-hyperscaler share of new installs goes from 25% in 2025 to 38% in 2027E, which puts the hyperscalers' share of new 2027 capacity at 62%. The flow runs ahead of the stock, and that is where the downward drift in the share comes from. Note too that Epoch's coverage is about 27% and concentrated on top-tier US sites, so China and sovereign compute are systematically undercounted. The true non-hyperscaler share can only be higher.
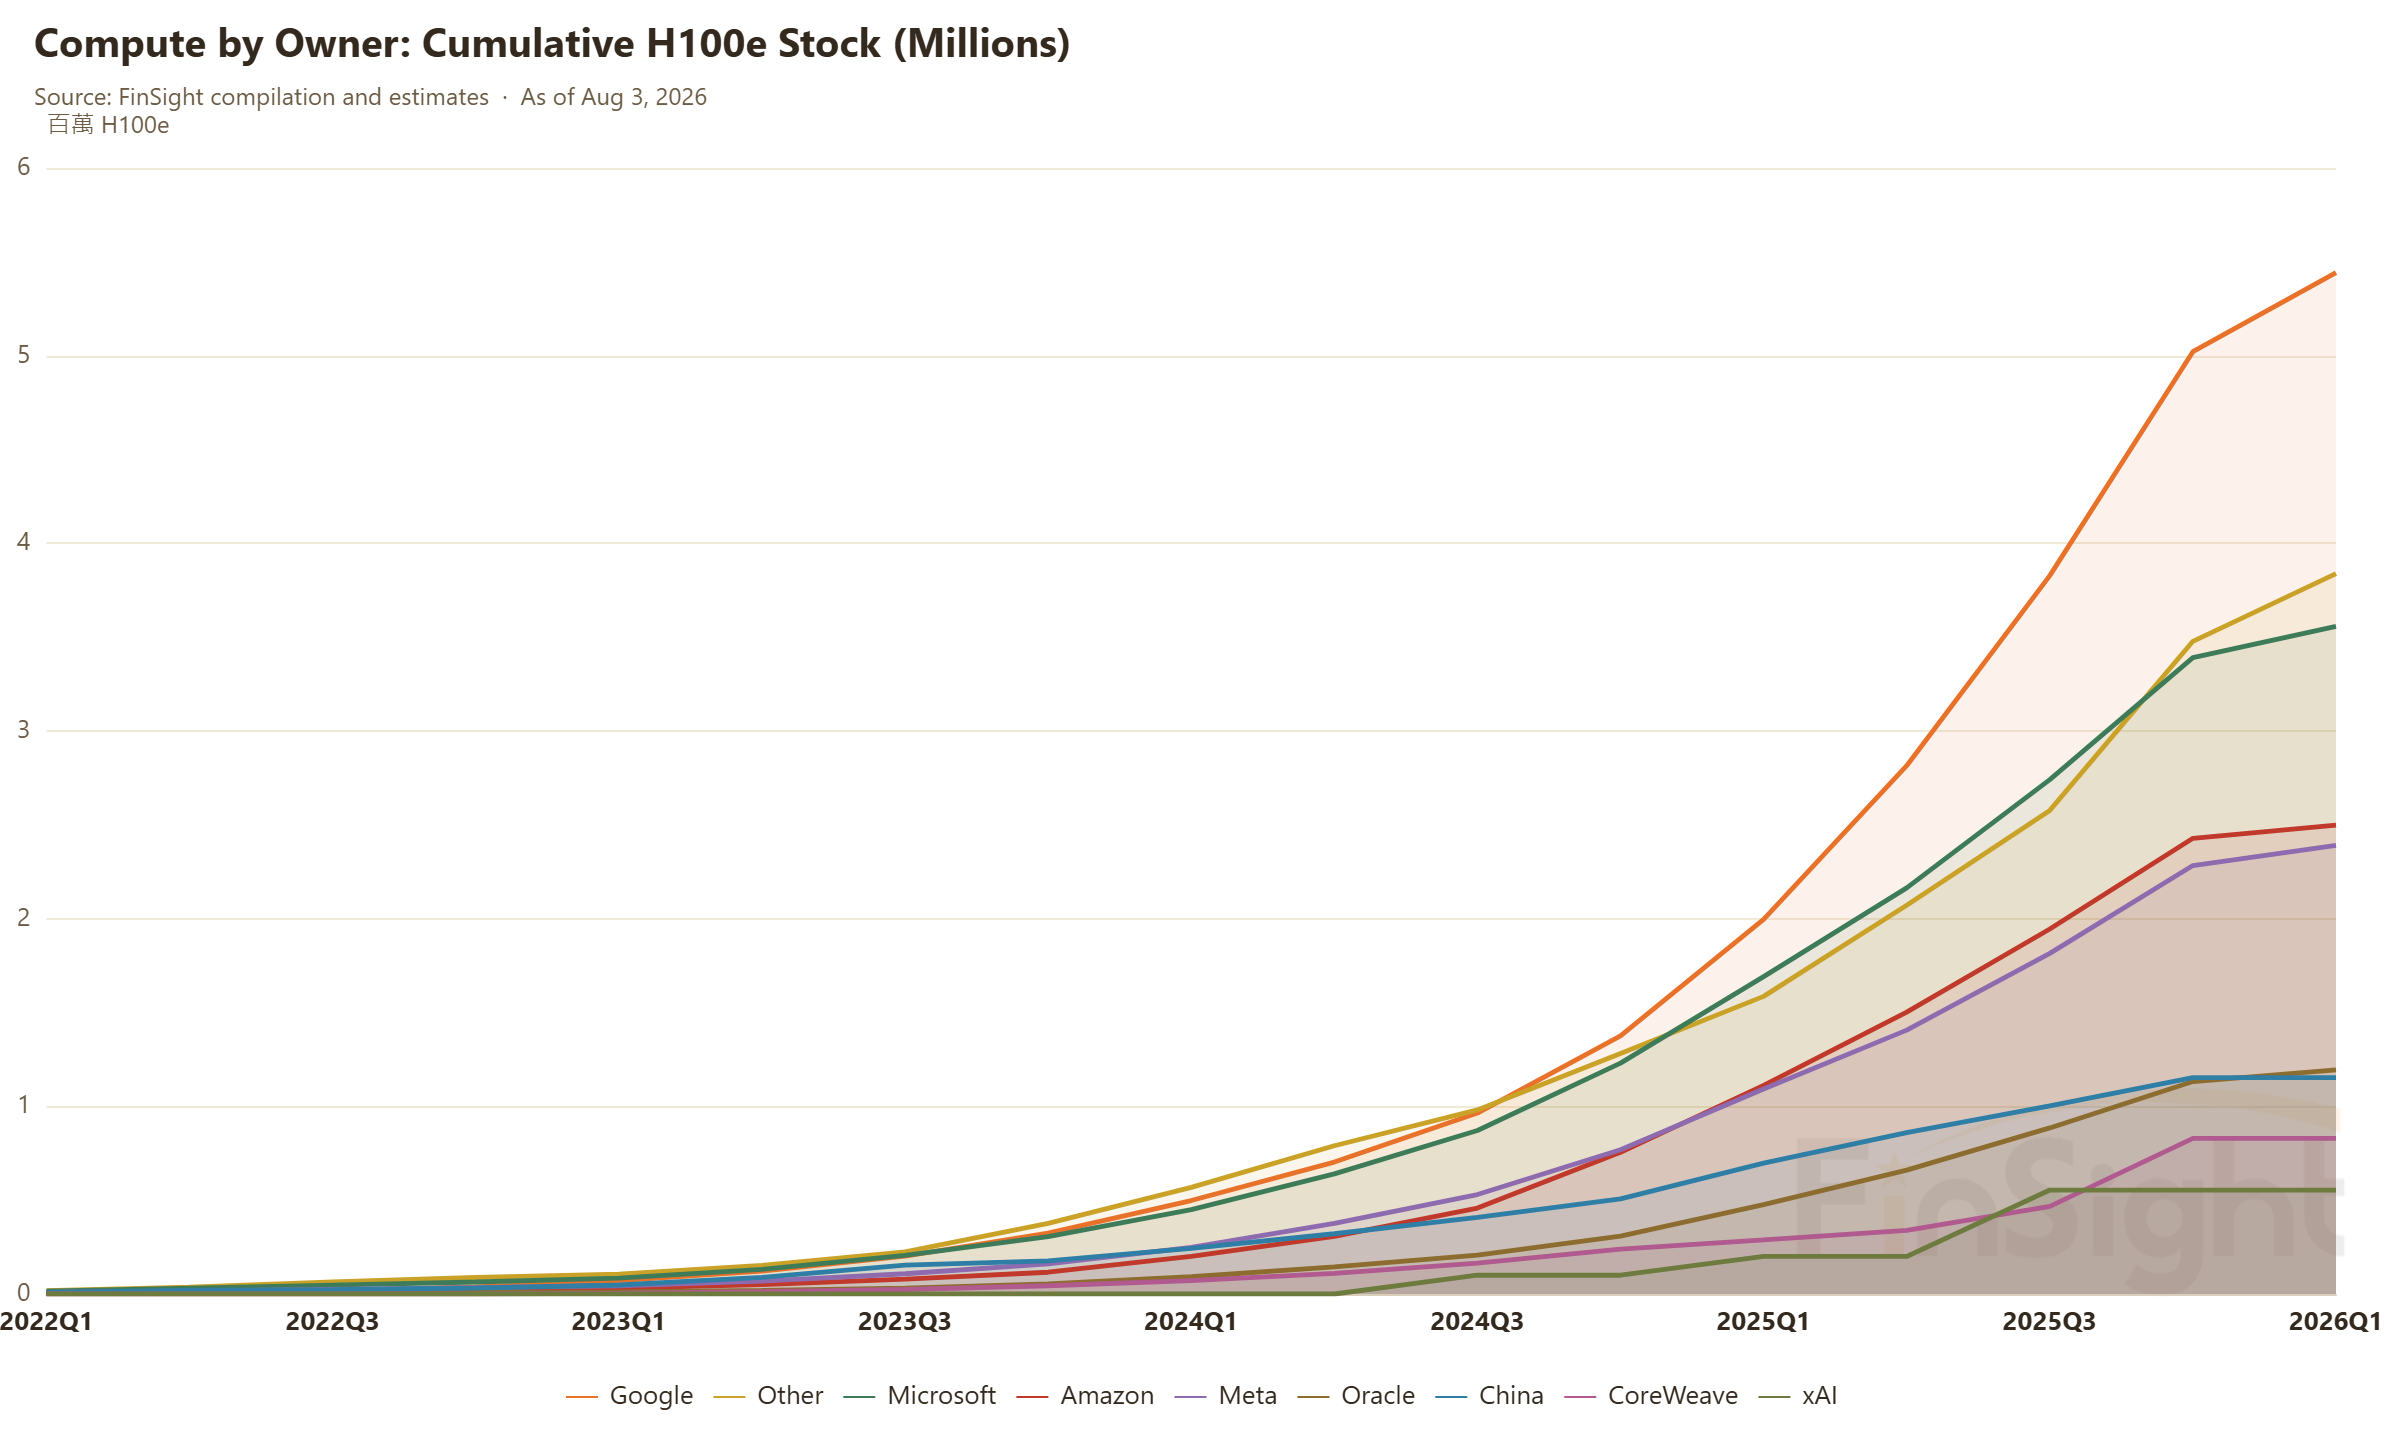
Installed-base growth: the five hyperscalers +210% in 2026 and +58% in 2027E; everyone else +311% and +74%. 2027E follows Epoch's site-by-site completion schedule; coverage skews to top-tier US sites, so the non-hyperscaler share is understated.
Method three: open the wallets and add up every dollar you can find
Definitions first. Buyer CapEx in this post means cash capital spending, the purchase of PP&E. Compute obtained through leases is not in it. That sits with the landlords, the colo and neocloud owners, and counts as non-hyperscaler capital spending.
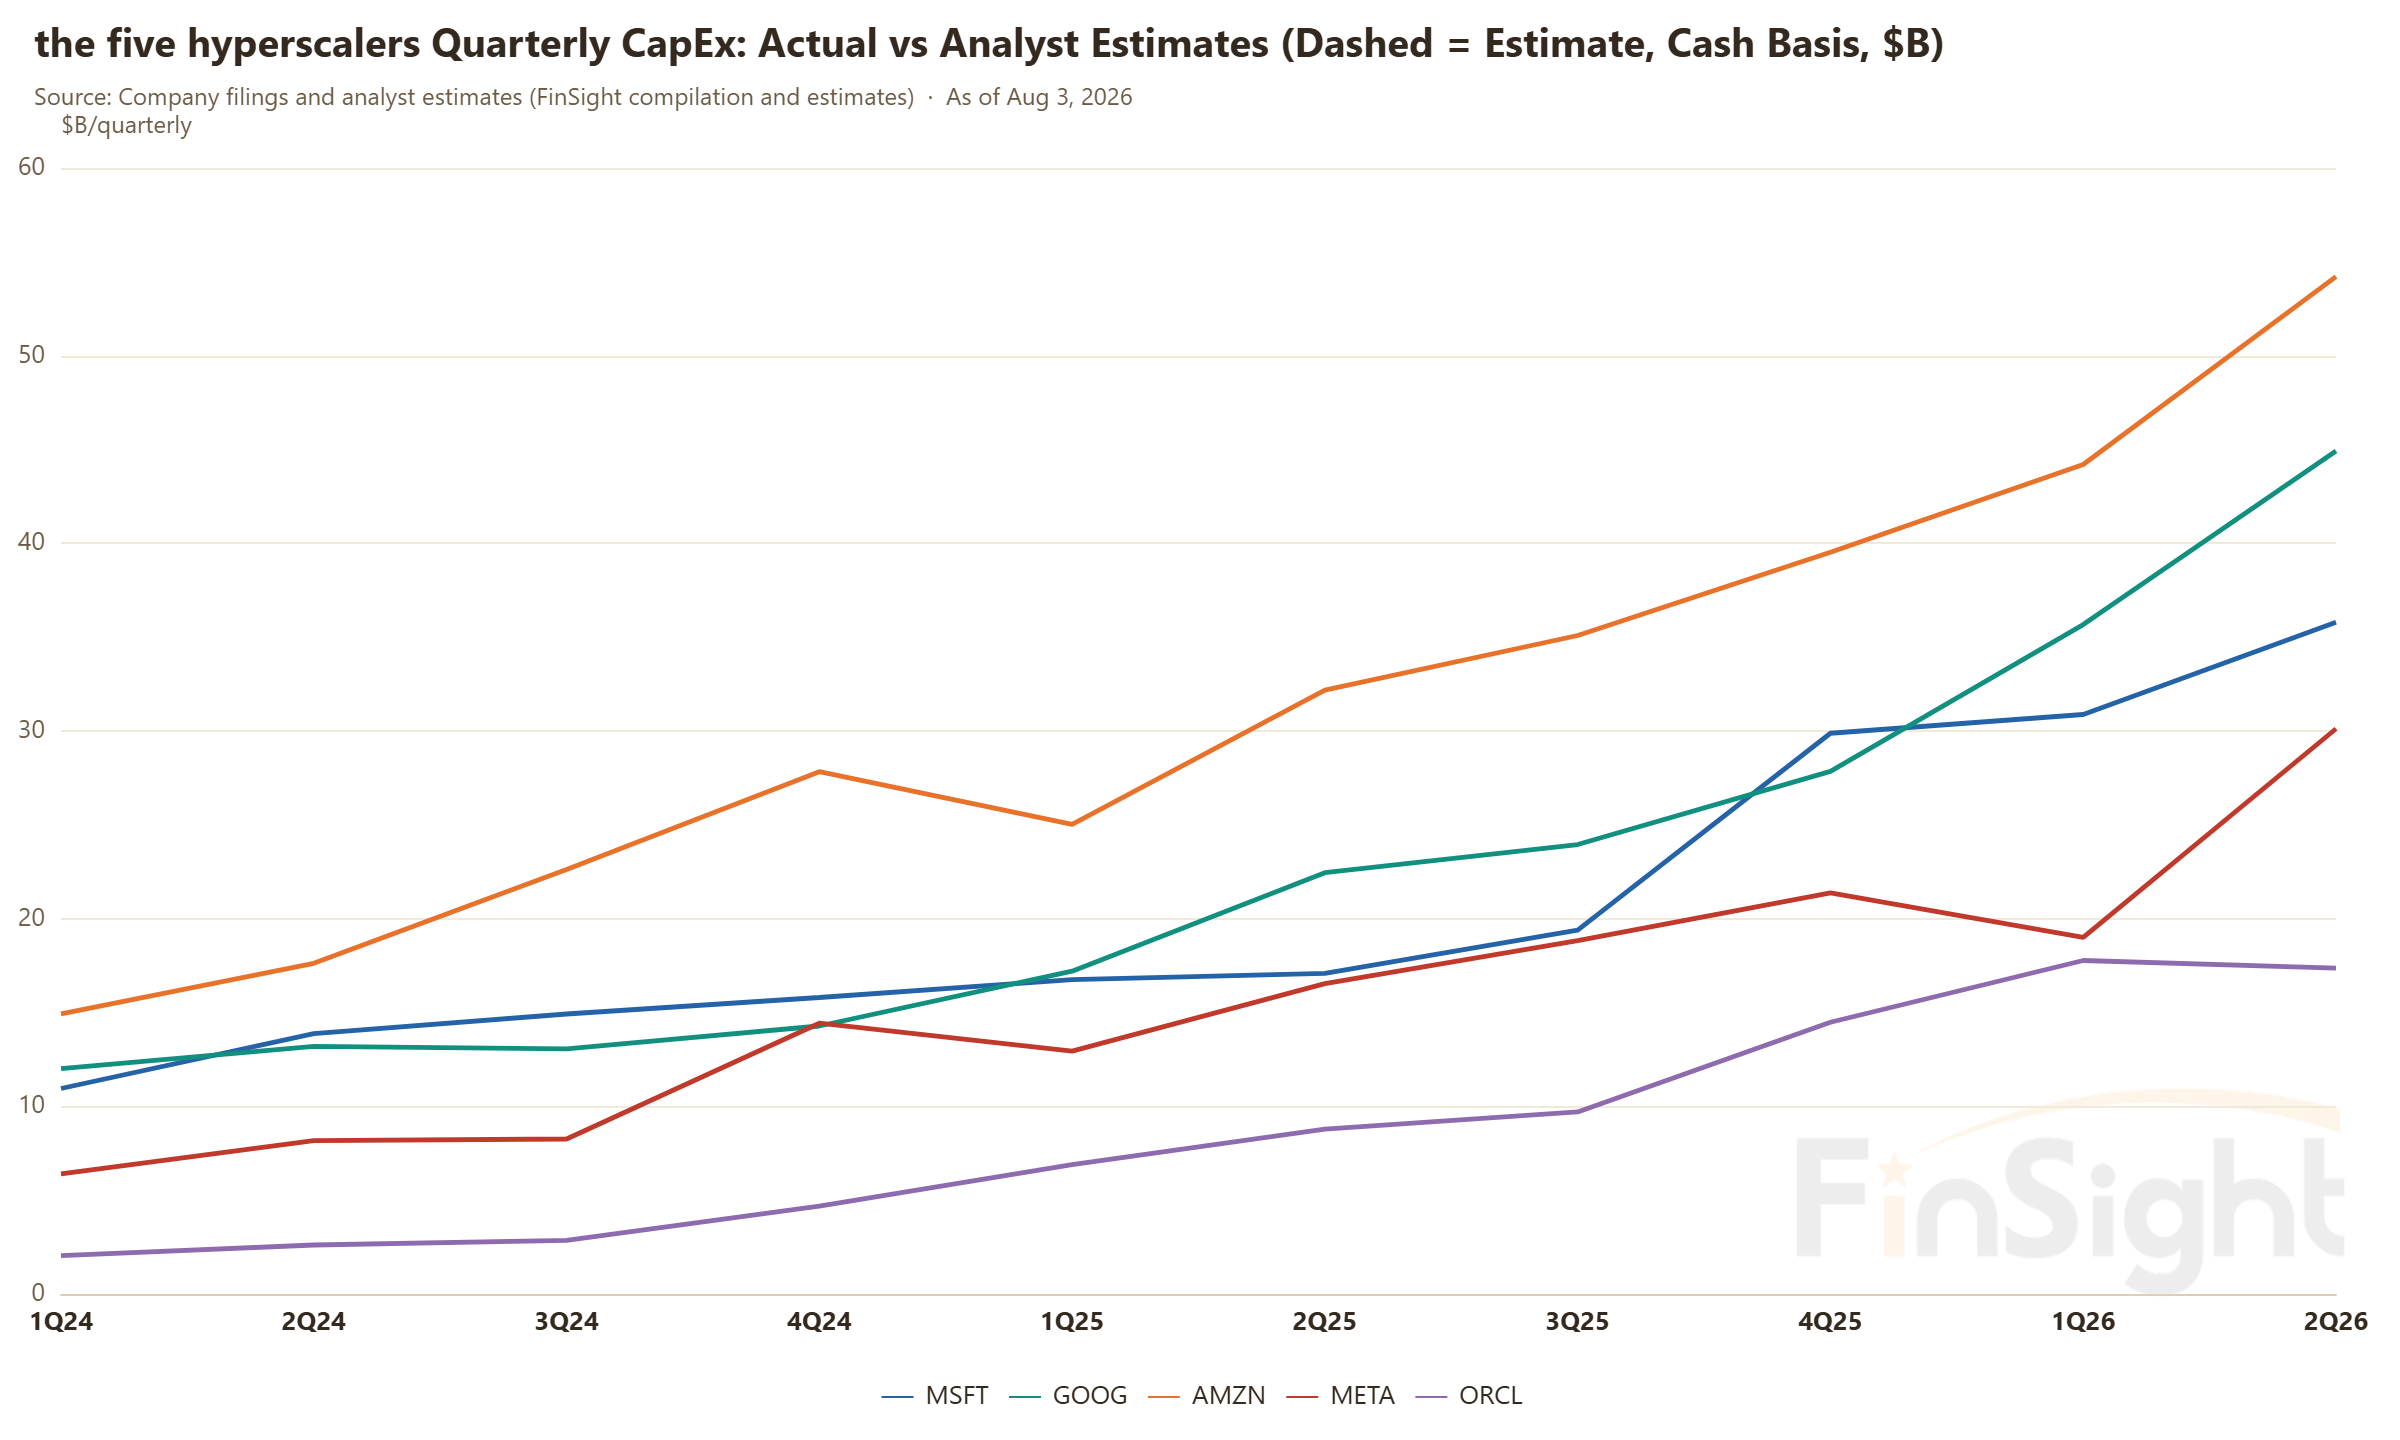
The hyperscalers are the only wallets in the market you can see all of: analyst consensus (FinSight compilation) puts 2026 at about $797B, most of the first half already actuals, and 2027 at about $1.10T, revised higher by 124% in a year.
What do the non-hyperscaler wallets look like? One honest caveat first: most of these buyers give no CapEx guidance, and what they announce is usually a multi-year program total, so forcing it into annual numbers is false precision. So here they are as reported, everything currently visible:
- CoreWeave: 2026 CapEx guidance of $30B to $35B; RPO of $99.4B (Microsoft, OpenAI, Meta, Anthropic).
- Nebius: 2026 guidance raised to $20B to $25B; a $27B five-year Meta contract plus $17B to $19B with Microsoft.
- ByteDance: 2026 CapEx announced at RMB 400B to 500B, funded entirely out of roughly $50B of annual profit.
- Alibaba: FY26 CapEx of RMB 126.1B confirmed, on top of a three-year RMB 380B base.
- Stargate SPV and xAI: about $52B of equity committed (the $500B is the headline vision); xAI's Series E was $20B.
- Sovereigns: Humain at about $77B through 2030 and the EU's InvestAI at EUR 200B, both multi-year; NVIDIA's 600,000-GPU long-term contract and Korea's 260,000-GPU agreement.
- General enterprise, through the Dell, HPE and Supermicro channel: Dell guides AI servers to $60B, and IDC puts enterprise at 13% to 16% of AI servers.
Add every dollar you can see, use it as the denominator, and what share do the hyperscalers have? $1,099B against $1,534B, about 70%. But that 70% can only be too high, never too low. The reason is simple. Every dollar of the hyperscalers is visible, none of it missing, while a great deal of non-hyperscaler money never gets counted at all: mid-size Chinese buyers, sovereign programs not yet announced, enterprises building their own. Every one of those missing dollars belongs to somebody other than a hyperscaler. Put them back and the denominator grows while the numerator does not, so the share can only fall. 70% is the ceiling. The real number sits below it.
Now swap the denominator for the market-wide bill we built in question one, and you get the hyperscalers' actual share. Hyperscaler capital spending for 2026 is currently estimated at $797B; divide by the $1,325B bill and you get about 60%. That denominator carries an estimate even for the money nobody can count, which makes it the closest thing we have to a measured number. So the ceiling is 70%, the measured read is about 60%, and the share does not run much past 60%.
So do supply chain revenue estimates and buyer capital spending tie out?
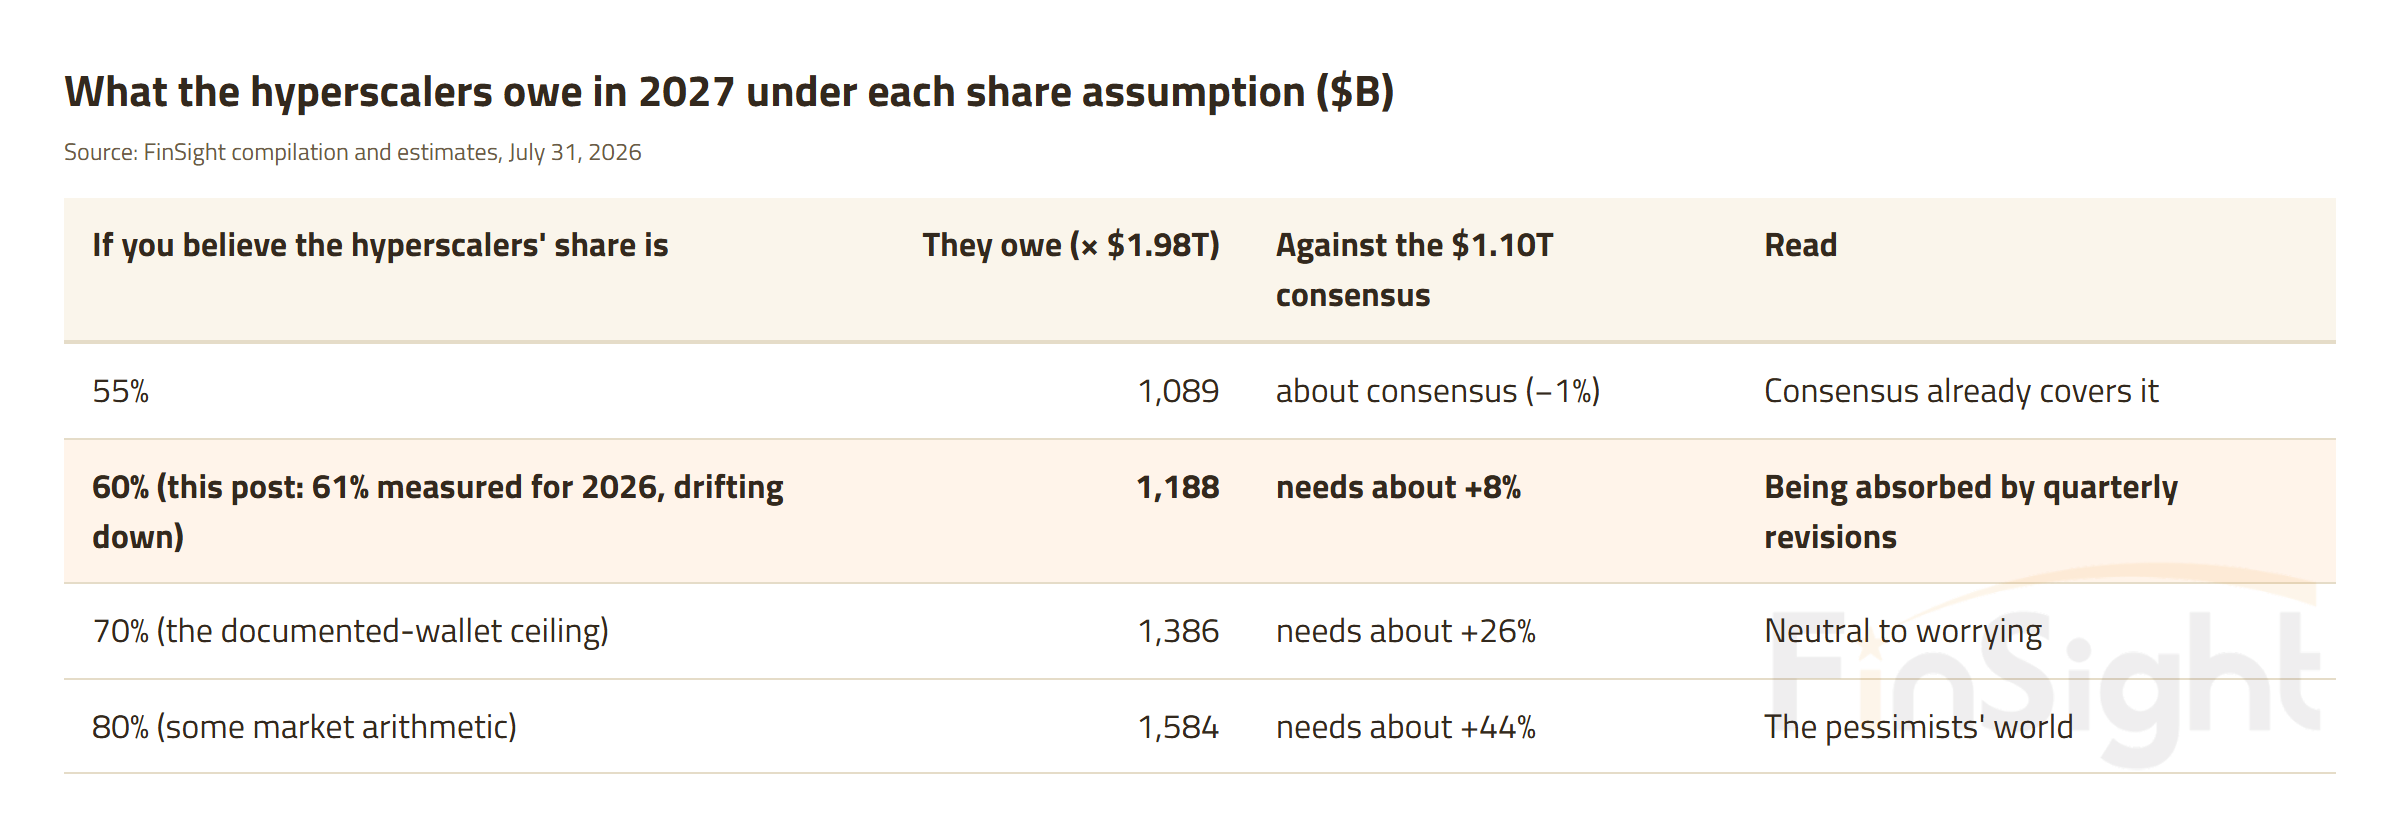
Back to the question. Question one sized the bill. To judge whether the two sides tie out, only one thing is missing: what share the hyperscalers actually owe. Strip the bull and bear argument down and that number is the whole fight. Assume 80% and the hole is terrifying. Assume 60% and the books balance.
The three yardsticks from question two already bracket it. Chip shipments weight out at about 63%, and the contract structure takes that lower over time. Satellite installs point to about 66% by the end of 2027, but coverage is concentrated on top-tier US sites and undercounts China and sovereigns, so the true value can only be lower. The documented-wallet ceiling is about 70% and is known to be too high. Three independent measurements, one range. FinSight puts the hyperscaler share a bit over 60%.
Run 2027 at the 60% baseline and the hyperscalers owe about $1.19T against today's $1.10T consensus, a difference of about 8%. Use the 63% from the shipment side and the gap widens to about 13%, which is to say hyperscaler CapEx estimates probably still have to come up. Is that hard? Recent history says hyperscaler CapEx consensus goes up almost every quarter, often by 10% or 20% at a time. At that slope, an 8% to 13% gap has a good chance of closing over the next one or two earnings calls. The bill the supply chain implies and the wallets of the people paying it do tie out.
| If you believe the hyperscalers' share is | They owe (× $1.98T) | Against the $1.10T consensus | Read |
|---|---|---|---|
| 55% | 1,089 | about consensus (−1%) | Consensus already covers it |
| 60% (this post: 61% measured for 2026, drifting down) | 1,188 | needs about +8% | Being absorbed by quarterly revisions |
| 70% (the documented-wallet ceiling) | 1,386 | needs about +26% | Neutral to worrying |
| 80% (some market arithmetic) | 1,584 | needs about +44% | The pessimists' world |
Source: FinSight compilation and estimates, July 31, 2026
| 360 days ago (Aug 8, 2025) | 270 days ago (Nov 6, 2025) | 180 days ago (Feb 4, 2026) | 90 days ago (May 5, 2026) | Now (Aug 3, 2026) | |
|---|---|---|---|---|---|
| 2026E: Alphabet | 98,293 | 127,061 | 147,618 | 186,590 | 201,039 |
| 2026E: Amazon | 128,893 | 146,390 | 153,805 | 199,553 | 217,335 |
| 2026E: Meta | 99,363 | 110,847 | 125,091 | 133,869 | 141,615 |
| 2026E: Microsoft | 90,918 | 106,381 | 114,016 | 160,511 | 158,679 |
| 2026E: Oracle | 28,151 | 43,499 | 57,522 | 59,569 | 78,745 |
| 2026E: Total | 445,618 | 534,178 | 598,053 | 740,093 | 797,413 |
| 2026E: change vs prior column | +19.9% | +12.0% | +23.8% | +7.7% | |
| 2027E: Alphabet | 102,854 | 137,181 | 169,264 | 243,714 | 310,191 |
| 2027E: Amazon | 146,121 | 167,362 | 187,520 | 230,346 | 273,965 |
| 2027E: Meta | 106,086 | 123,369 | 153,325 | 173,195 | 209,349 |
| 2027E: Microsoft | 102,519 | 121,126 | 133,749 | 186,702 | 205,407 |
| 2027E: Oracle | 31,942 | 63,847 | 67,904 | 76,458 | 100,102 |
| 2027E: Total | 489,521 | 612,885 | 711,762 | 910,415 | 1,099,014 |
| 2027E: change vs prior column | +25.2% | +16.1% | +27.9% | +20.7% |
Cash-basis capex for Microsoft, Alphabet, Amazon, Meta and Oracle. Each column is the consensus estimate on that date.
Source: Analyst consensus (FinSight compilation)
Back to the worry we opened with. The problem with the claim that supply chain estimates have to come down may not be on the supply chain side at all. The buyer side may simply have the arithmetic wrong. Hand the entire market-wide bill to hyperscalers who carry a bit over 60% of it, and of course the hole looks enormous. Put the right number in the denominator and the gap is 8% to 13%, and it is the kind of 8% to 13% that quarterly upward revisions absorb.
What is actually worth watching from here is not the bill but the reason anyone pays it: cloud growth, where hyperscaler CapEx has historically grown at least as fast as public cloud, and whether AI applications can take the baton. Through this earnings season we will keep updating the scorecard against the line the last two posts drew, that compute keeps getting tighter and the money is a year away.
As always: this is our math and our assumptions, put on the record so we can check them later. You have your own model, so run it. The market settles it for all of us in the end.