
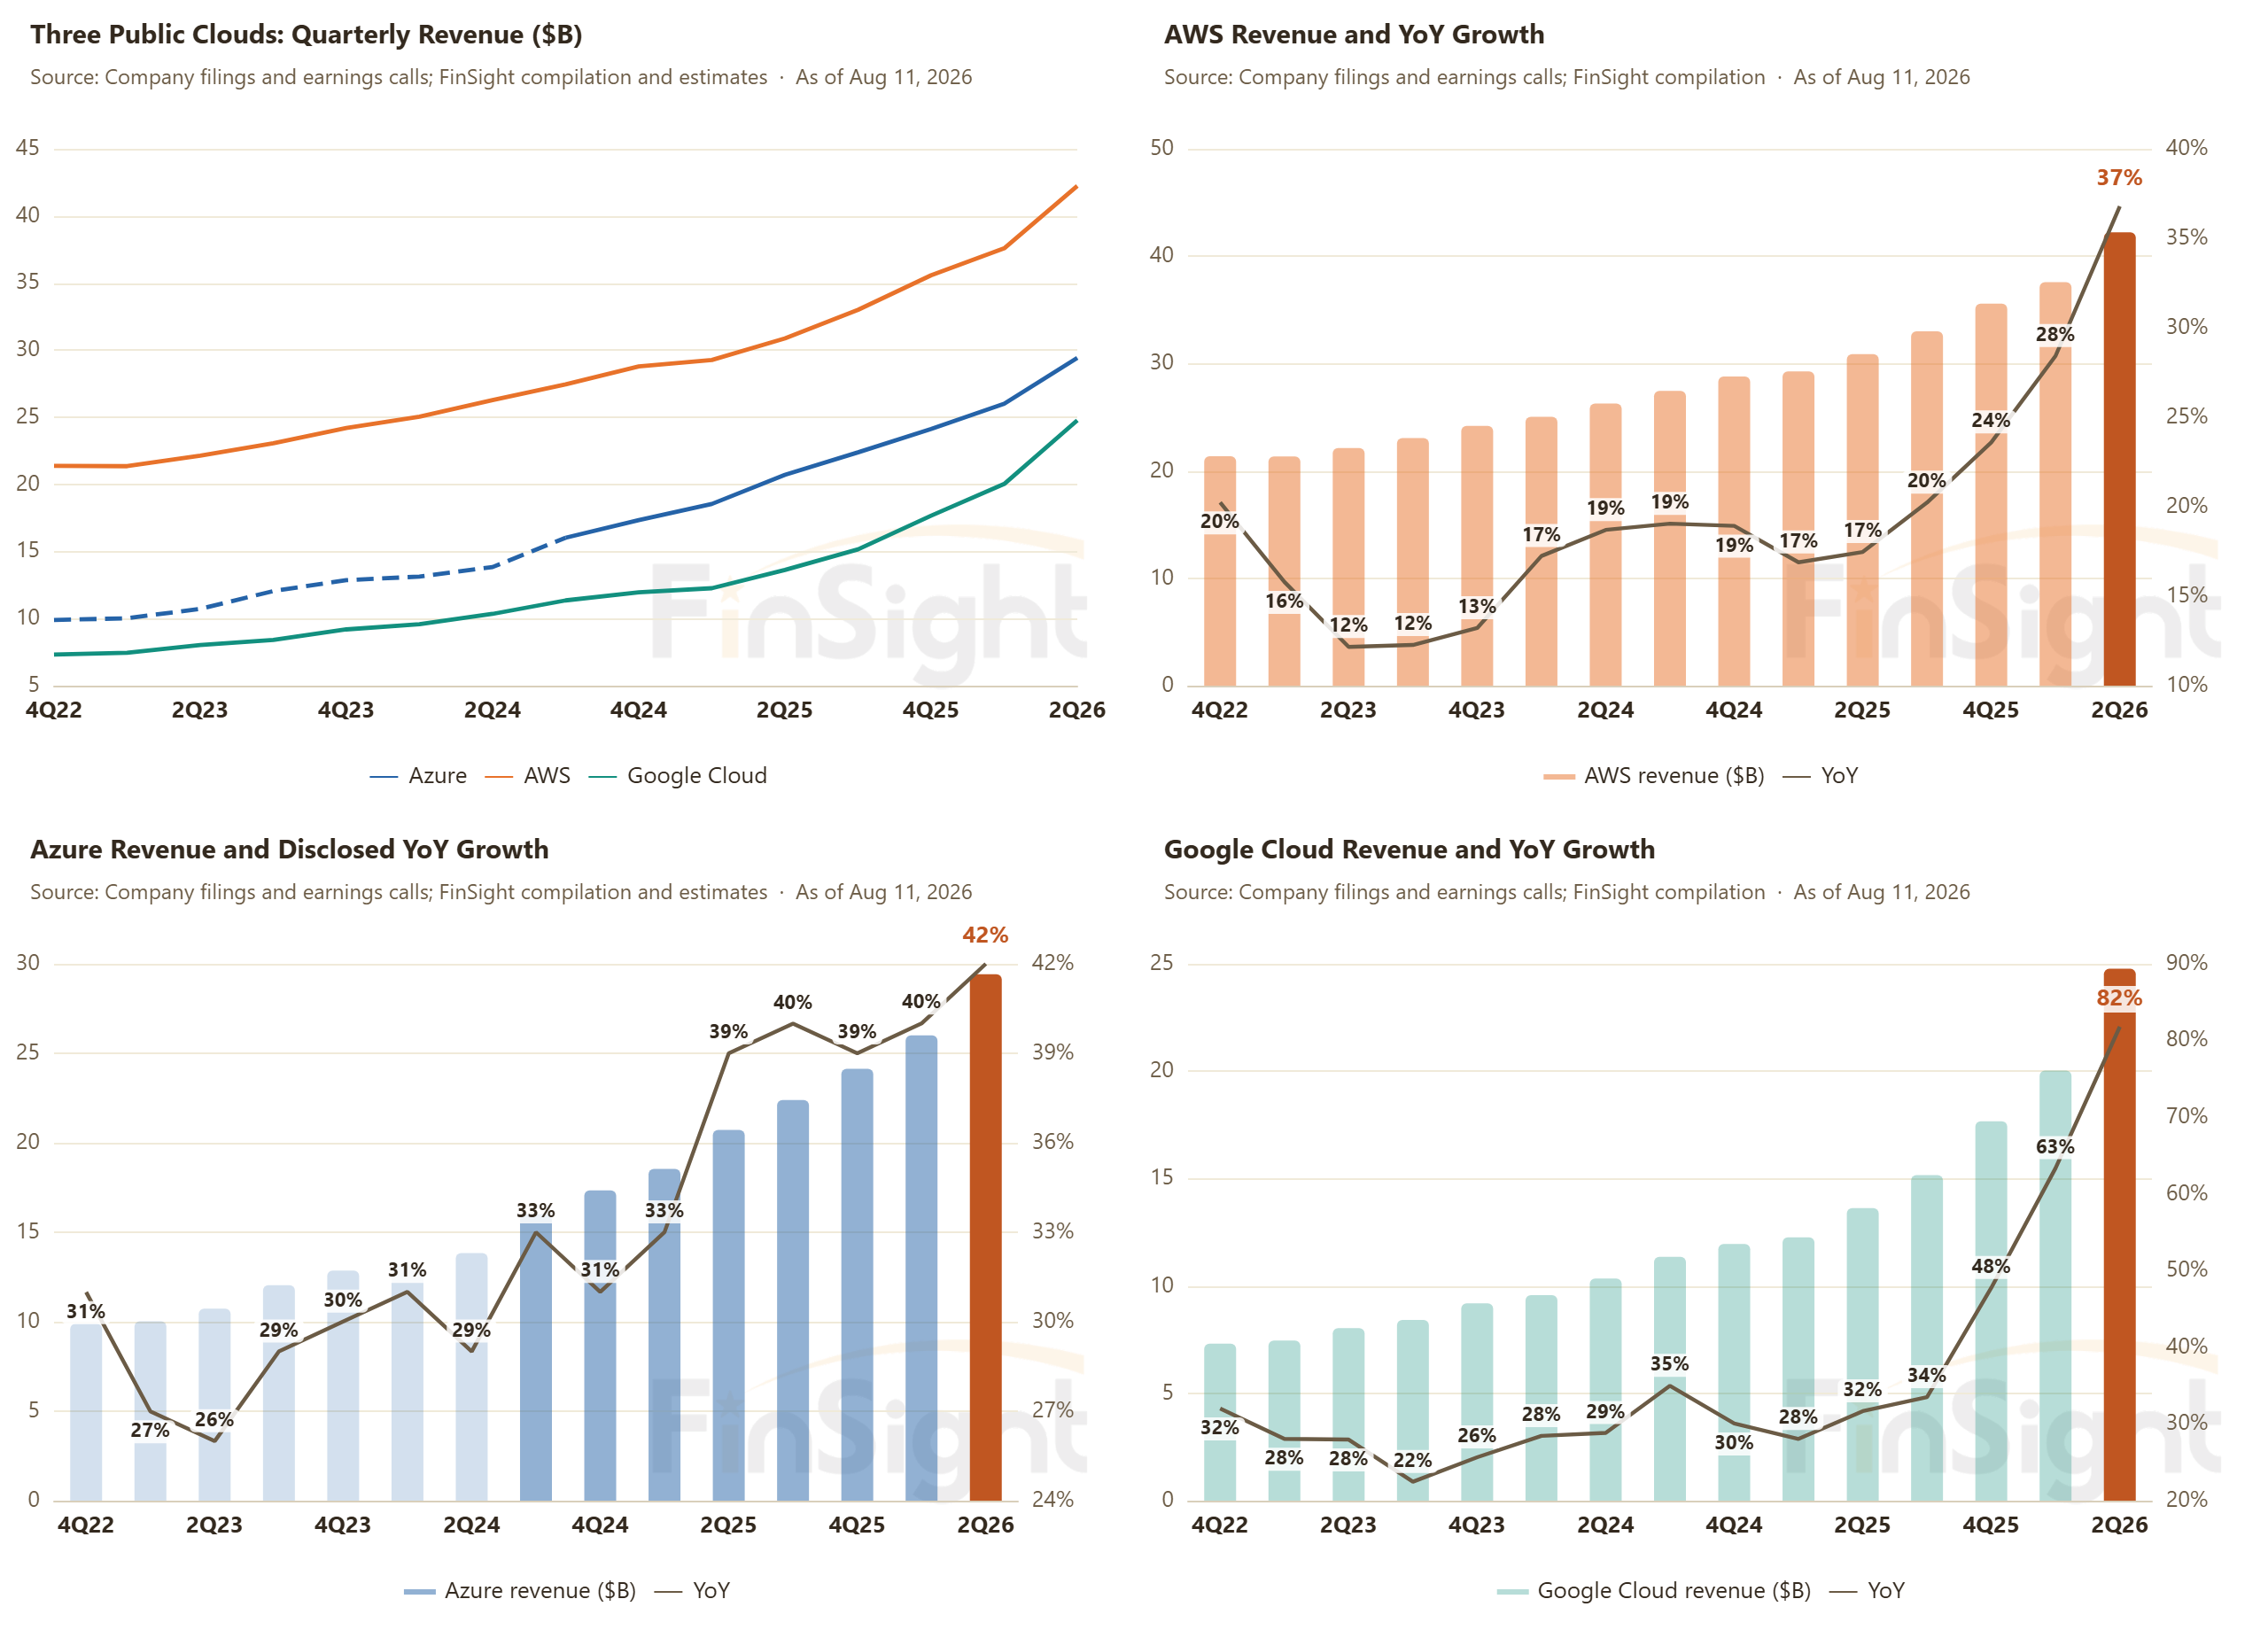
AWS grew 36.7%, Azure 43% and Google Cloud 82% while every one of them was short of capacity to sell, with order books now running into 2028.
Demand: the three public clouds accelerated while capacity-constrained, and the book runs into 2028
AWS, Azure and Google Cloud all accelerated this quarter. AWS grew 36.7% year over year, its fifth straight quarter of acceleration and the fastest in 18 quarters. Azure grew 43%, with next-quarter guidance calling for roughly 45%. Google Cloud grew 82%, which includes the first revenue from selling TPUs to outside buyers; strip that definitional change out and the underlying trend had already accelerated five quarters running.
Key takeaways
- AWS grew 36.7%, Azure 43% and Google Cloud 82%, all three while capacity-constrained, on combined quarterly revenue near $97B.
- Order books run into 2028: Microsoft RPO $678B, Google $514B, AWS $496B, with leases signed but not yet commenced near $800B.
- Amazon put a number on payback. AWS gear breaks even in under three years, about $4.3k-6.3k per chip a year, straddling our cost band.
- Compute is being bid for as an asset. Meta is getting premium offers for its own capacity; SpaceX sold $6.7B of capacity for six months.
Add the three together and the scale is hard to believe. Combined revenue is close to $97B in a single quarter, an annualized run-rate near $400B, and the whole thing still grew about 48%. We cannot remember a base that size compounding at that rate. And the companies say all of it happened while they were capacity-constrained. They accelerated in a shortage, which means every unit of effective supply gets bought the moment it lands.
Sundar Pichai: demand for the models is turning into heavy token usage from developers and enterprise customers, and Google is still capacity-constrained, which he reads as a sign of momentum and fast adoption. Google's CFO was blunter. Cloud revenue would have been higher without the near-term compute constraint.
Microsoft CFO Amy Hood said the revenue beat came from squeezing extra capacity out of the CPU and GPU fleet, and that the extra capacity was monetized almost immediately.
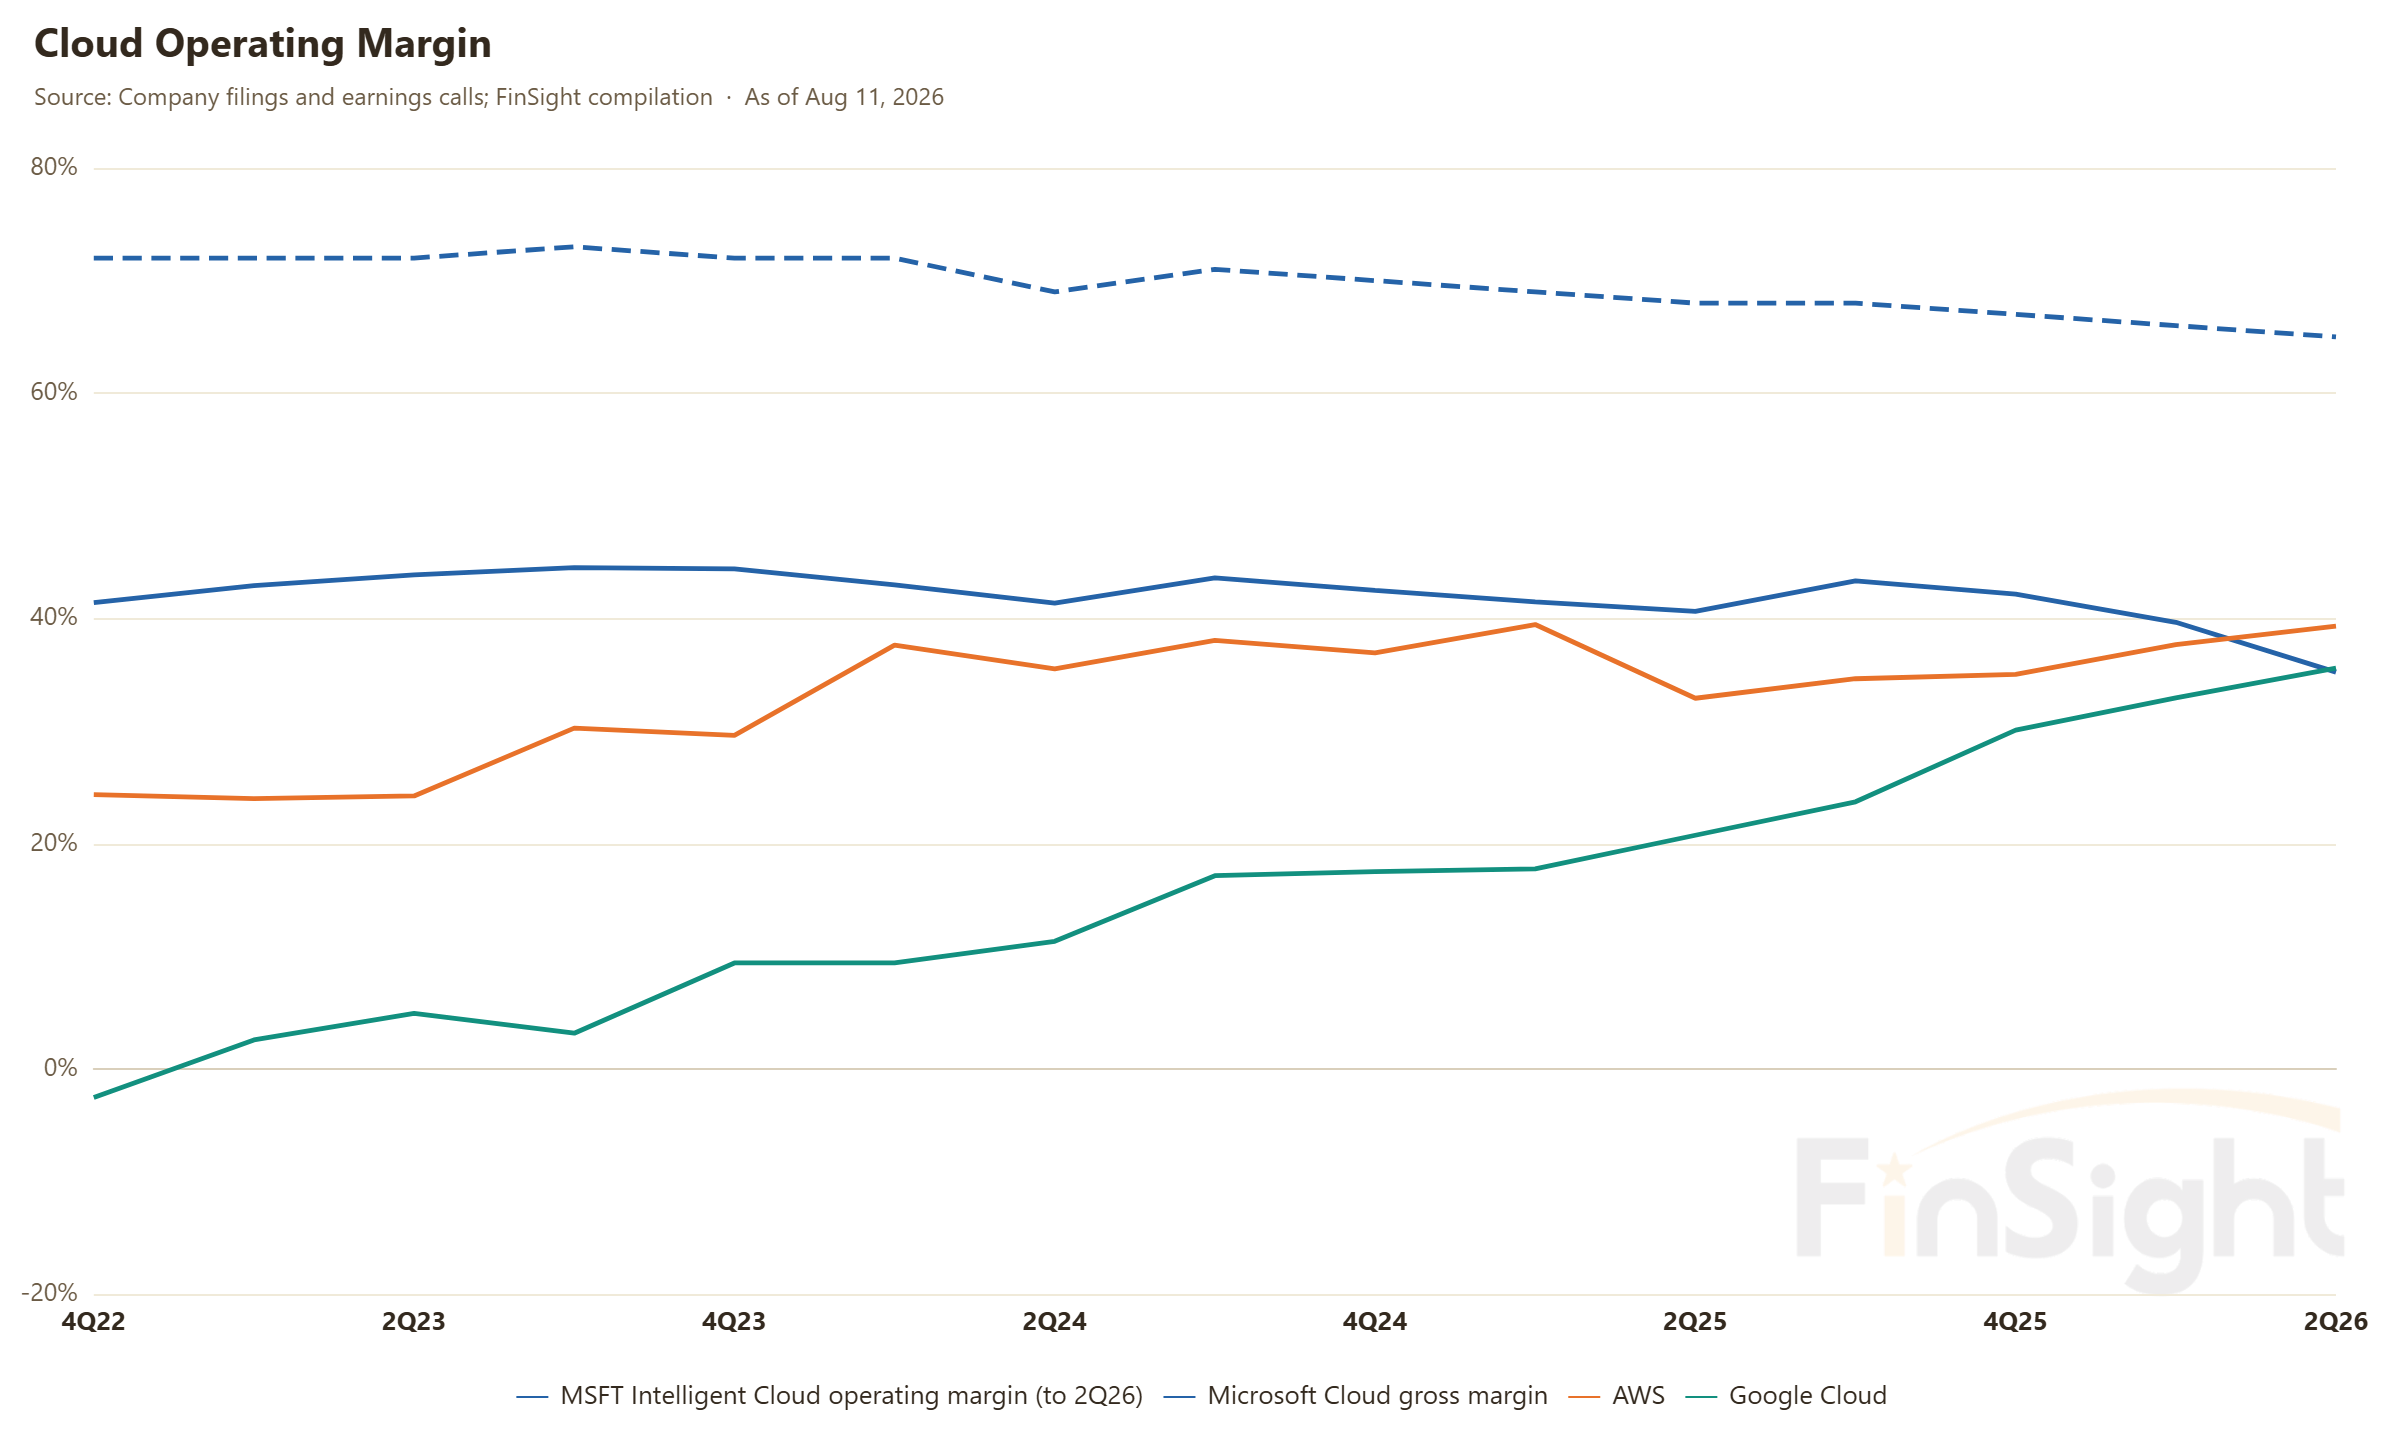
None of this growth was bought with margin. Google Cloud's operating margin went from 20.7% to 35.6% in a year. AWS cut its server depreciation life from six years to five last year, and even carrying that headwind its operating margin went from 32.9% to 39.3%. Microsoft's cloud gross margin is trending down, but 65% still came in ahead of expectations.
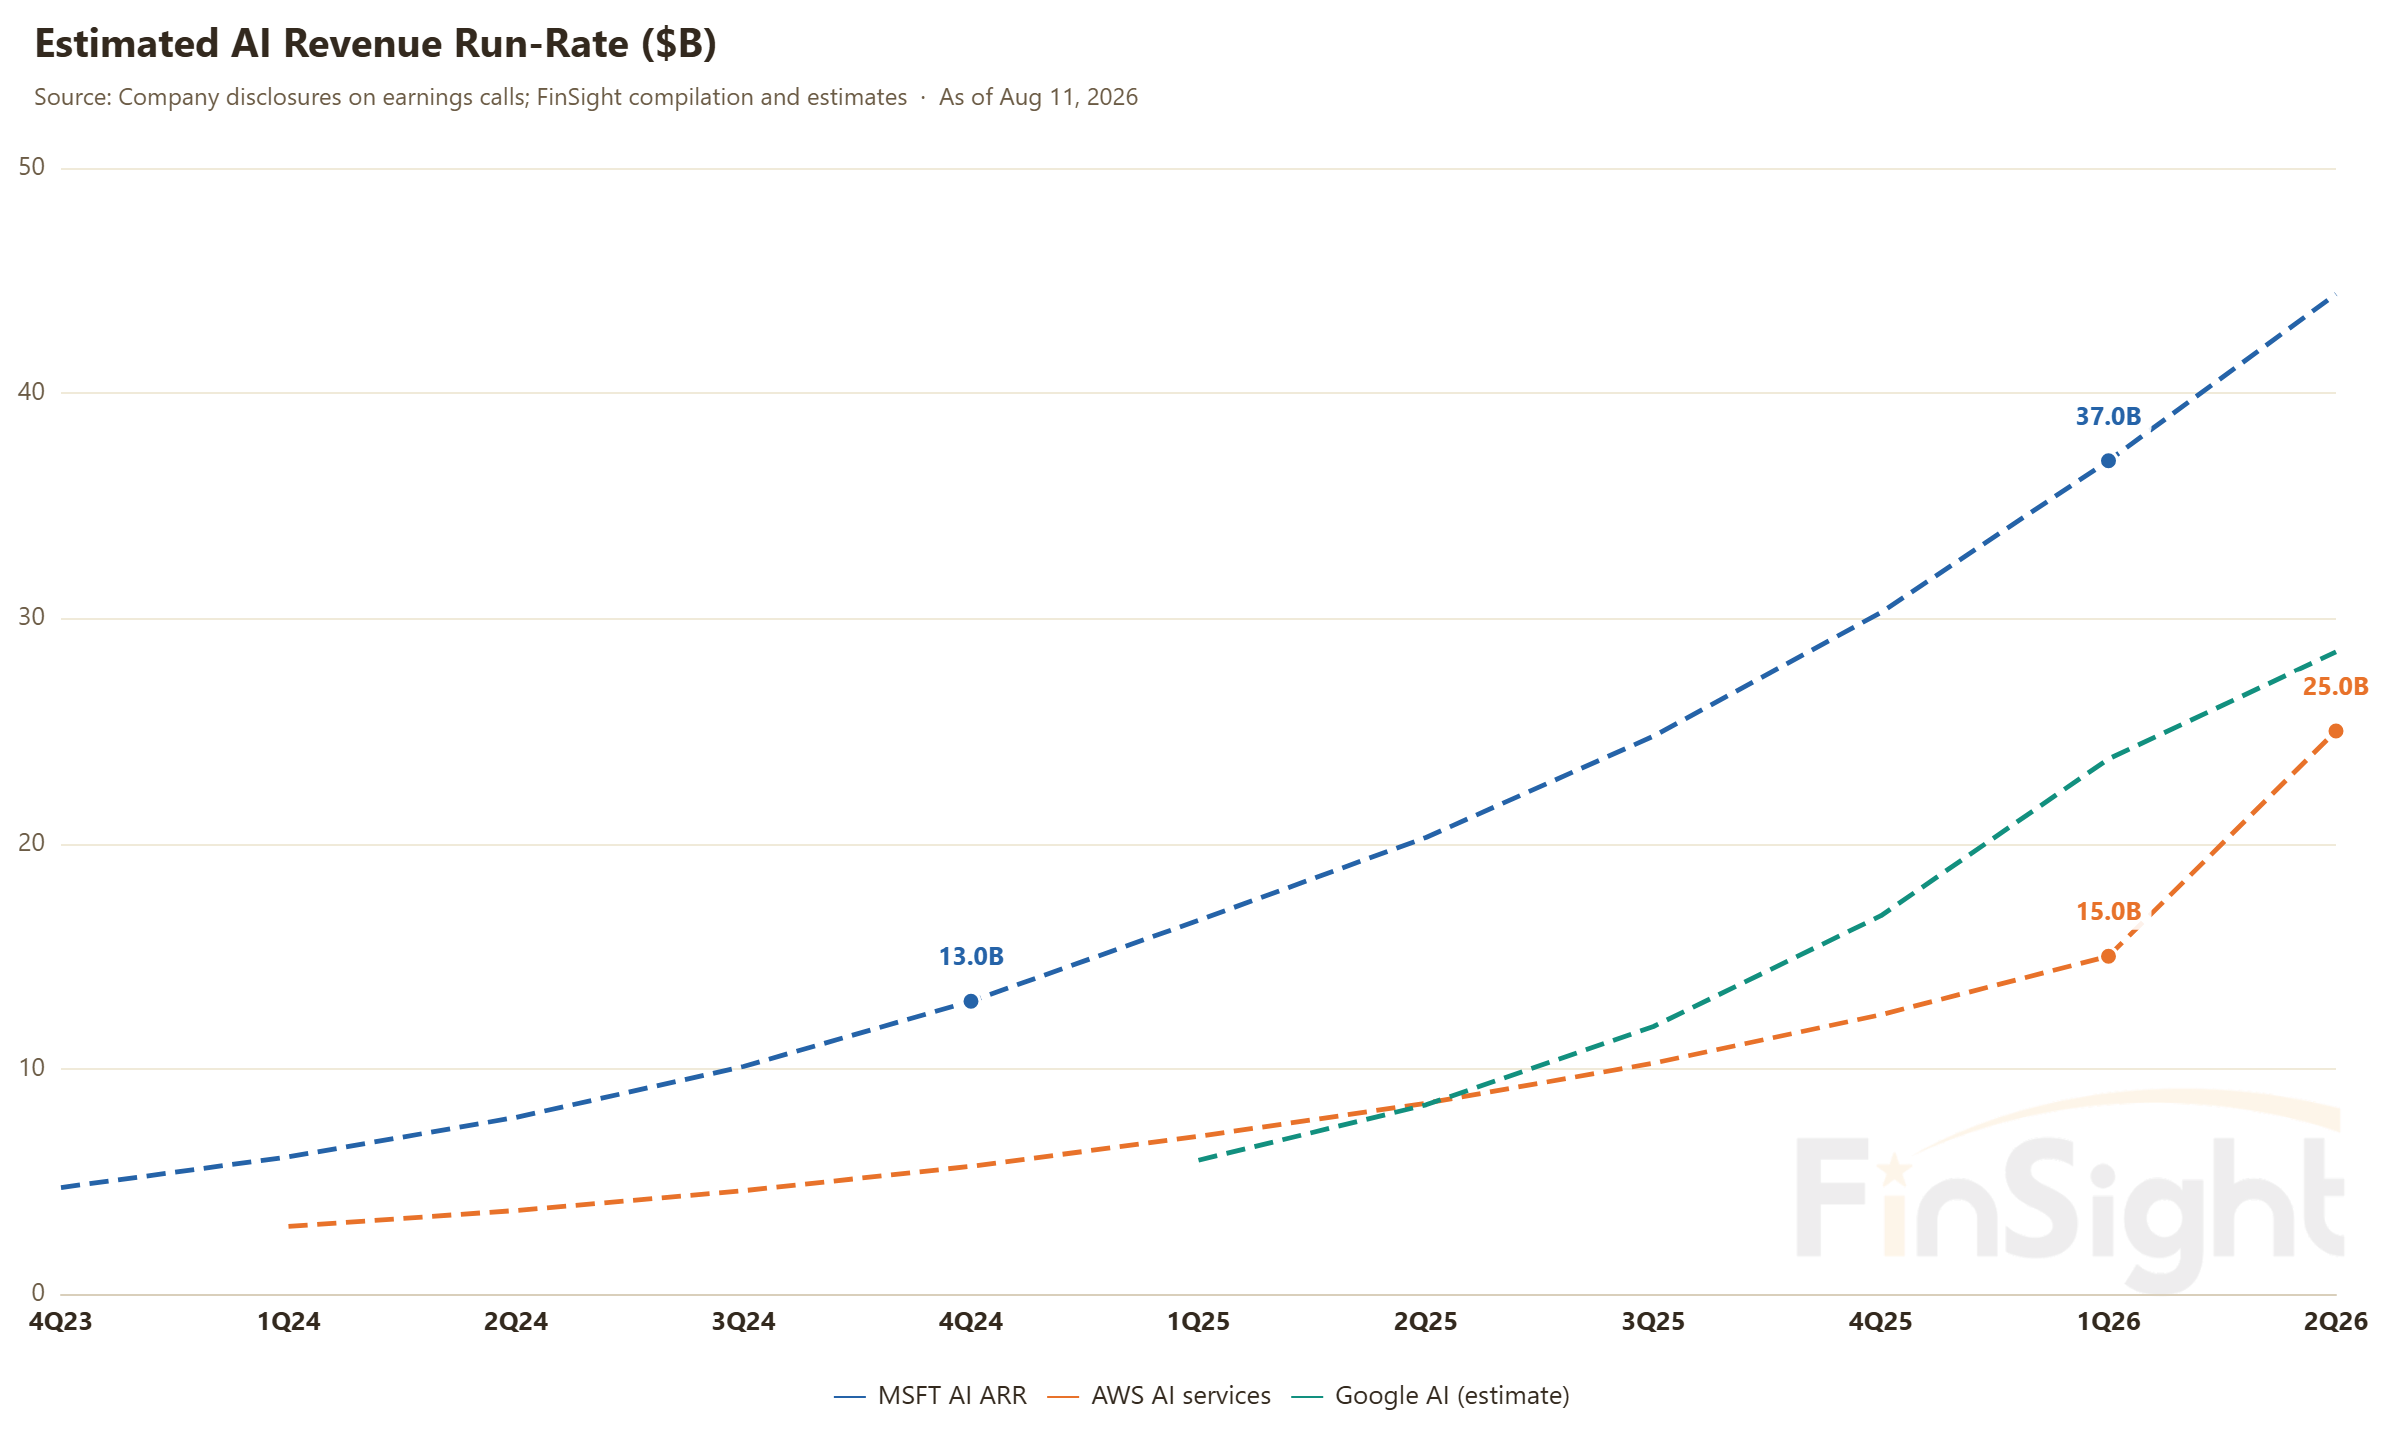
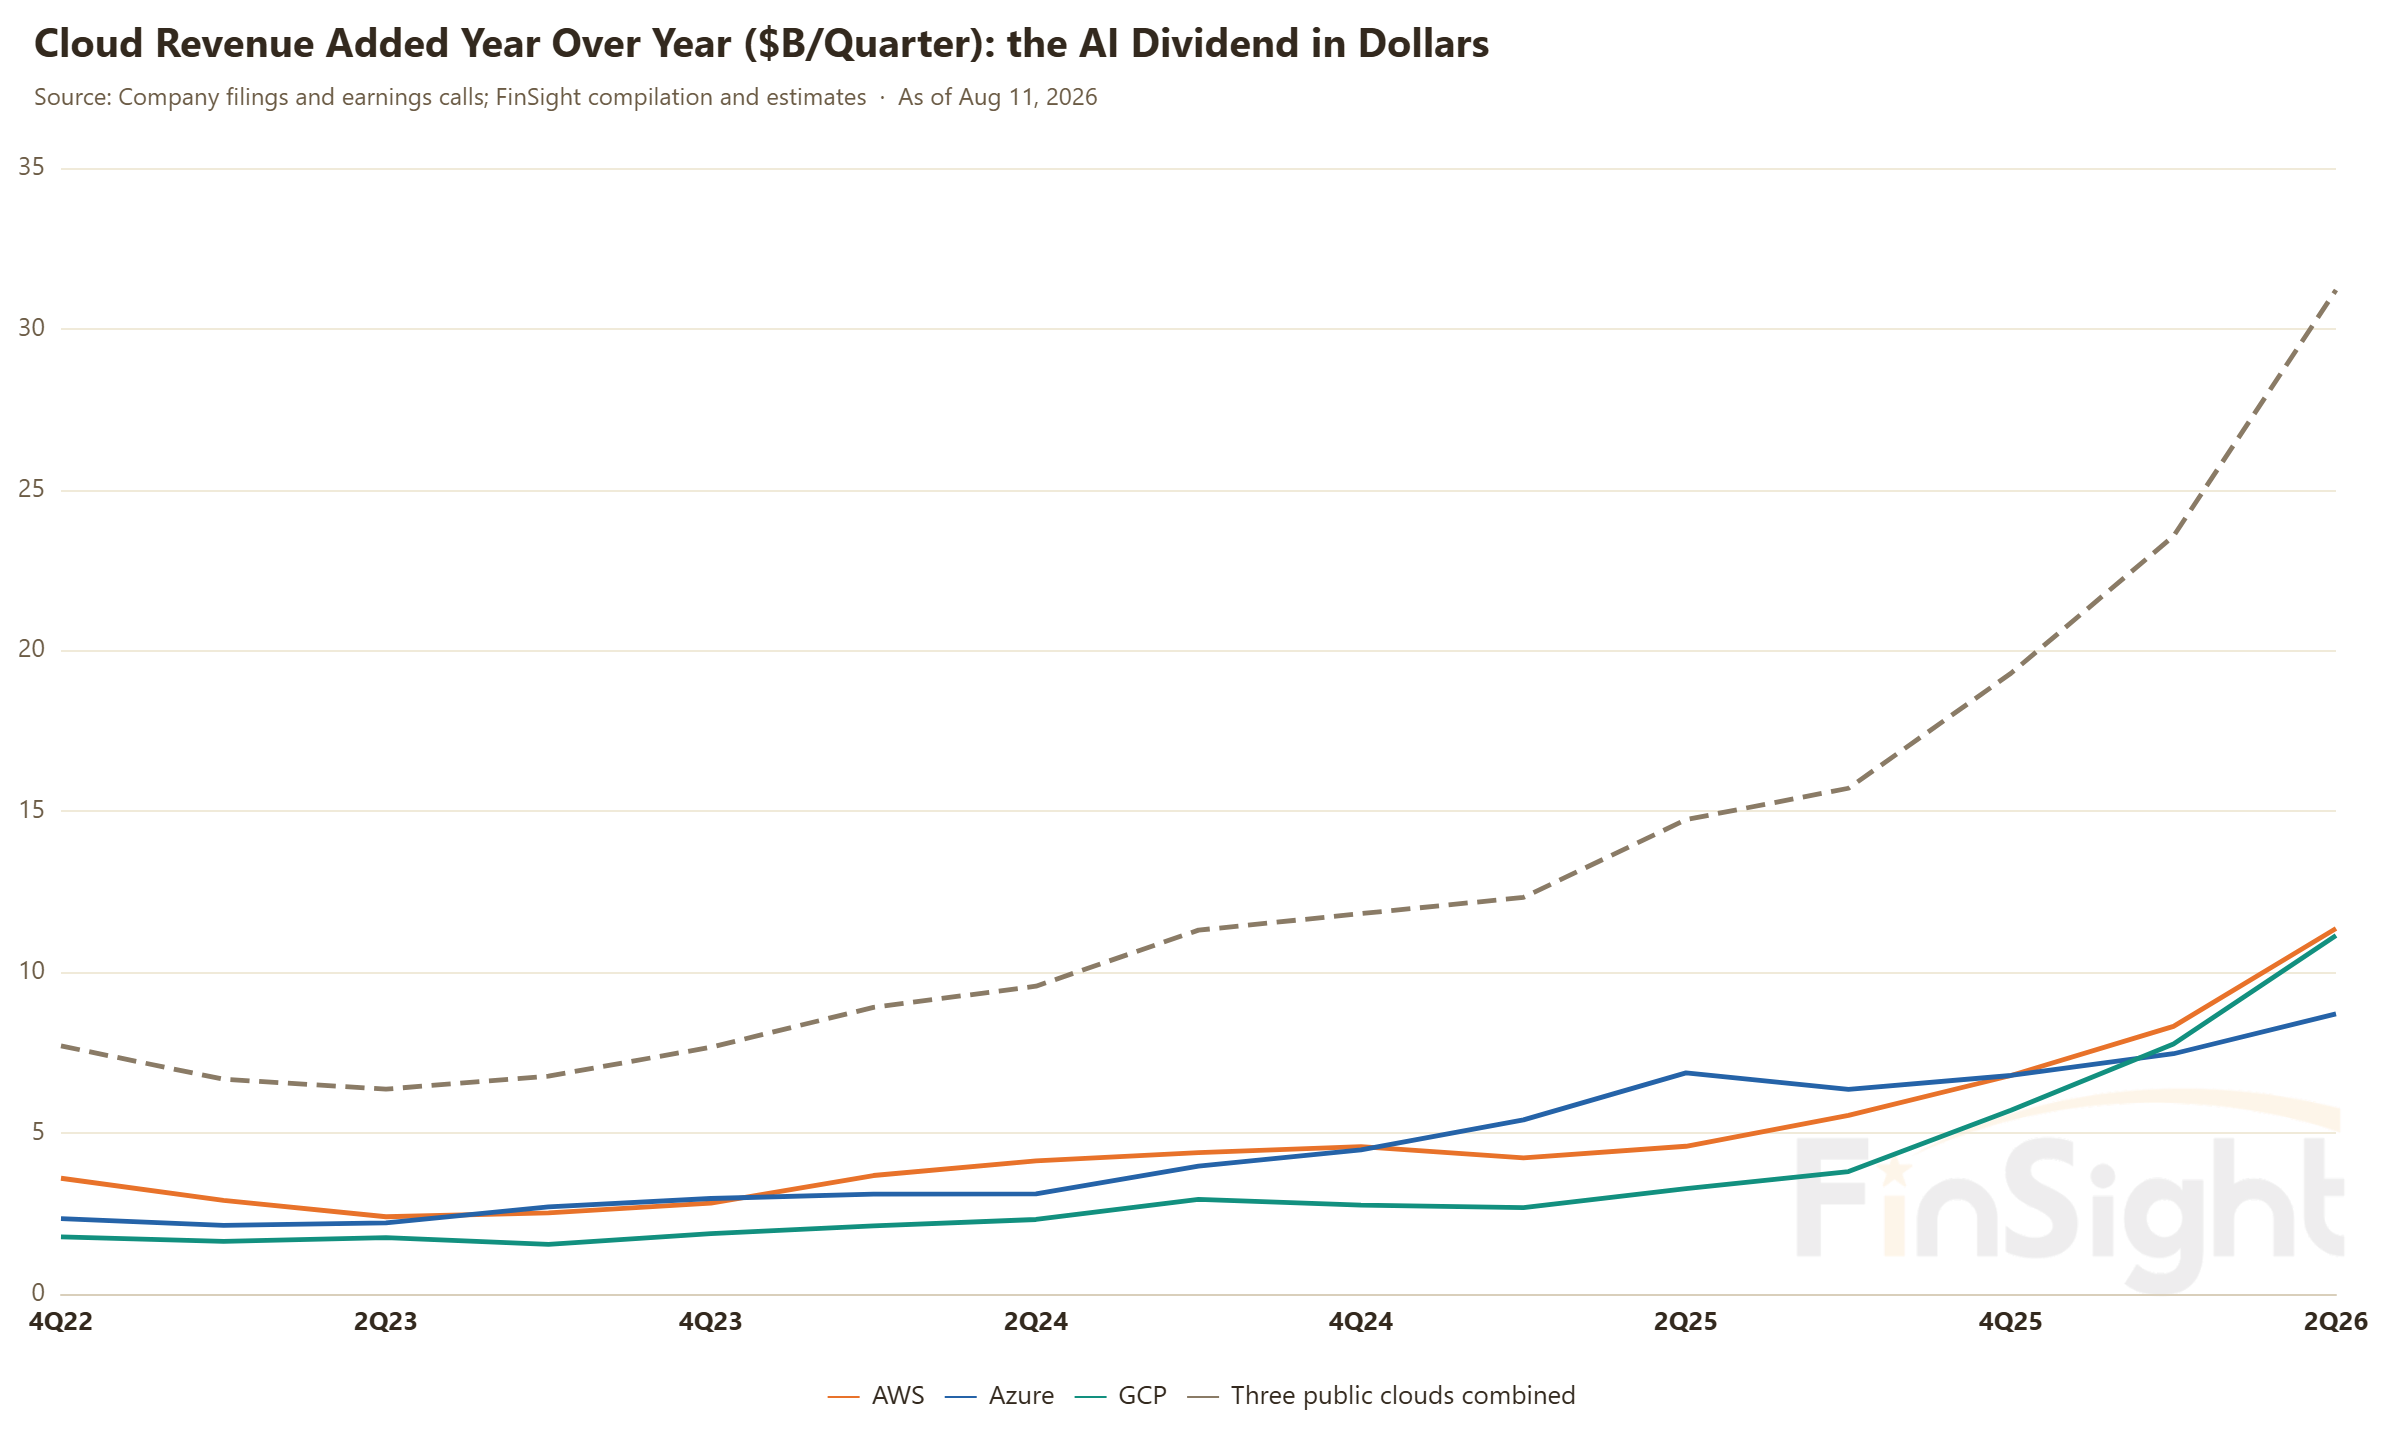
Pull the AI contribution out on its own and both the size and the quality are improving. The three public clouds added $31.4B of revenue year over year this quarter, against $13.7B in the same quarter last year. AI services went from 7% of AWS to 15% in a year.
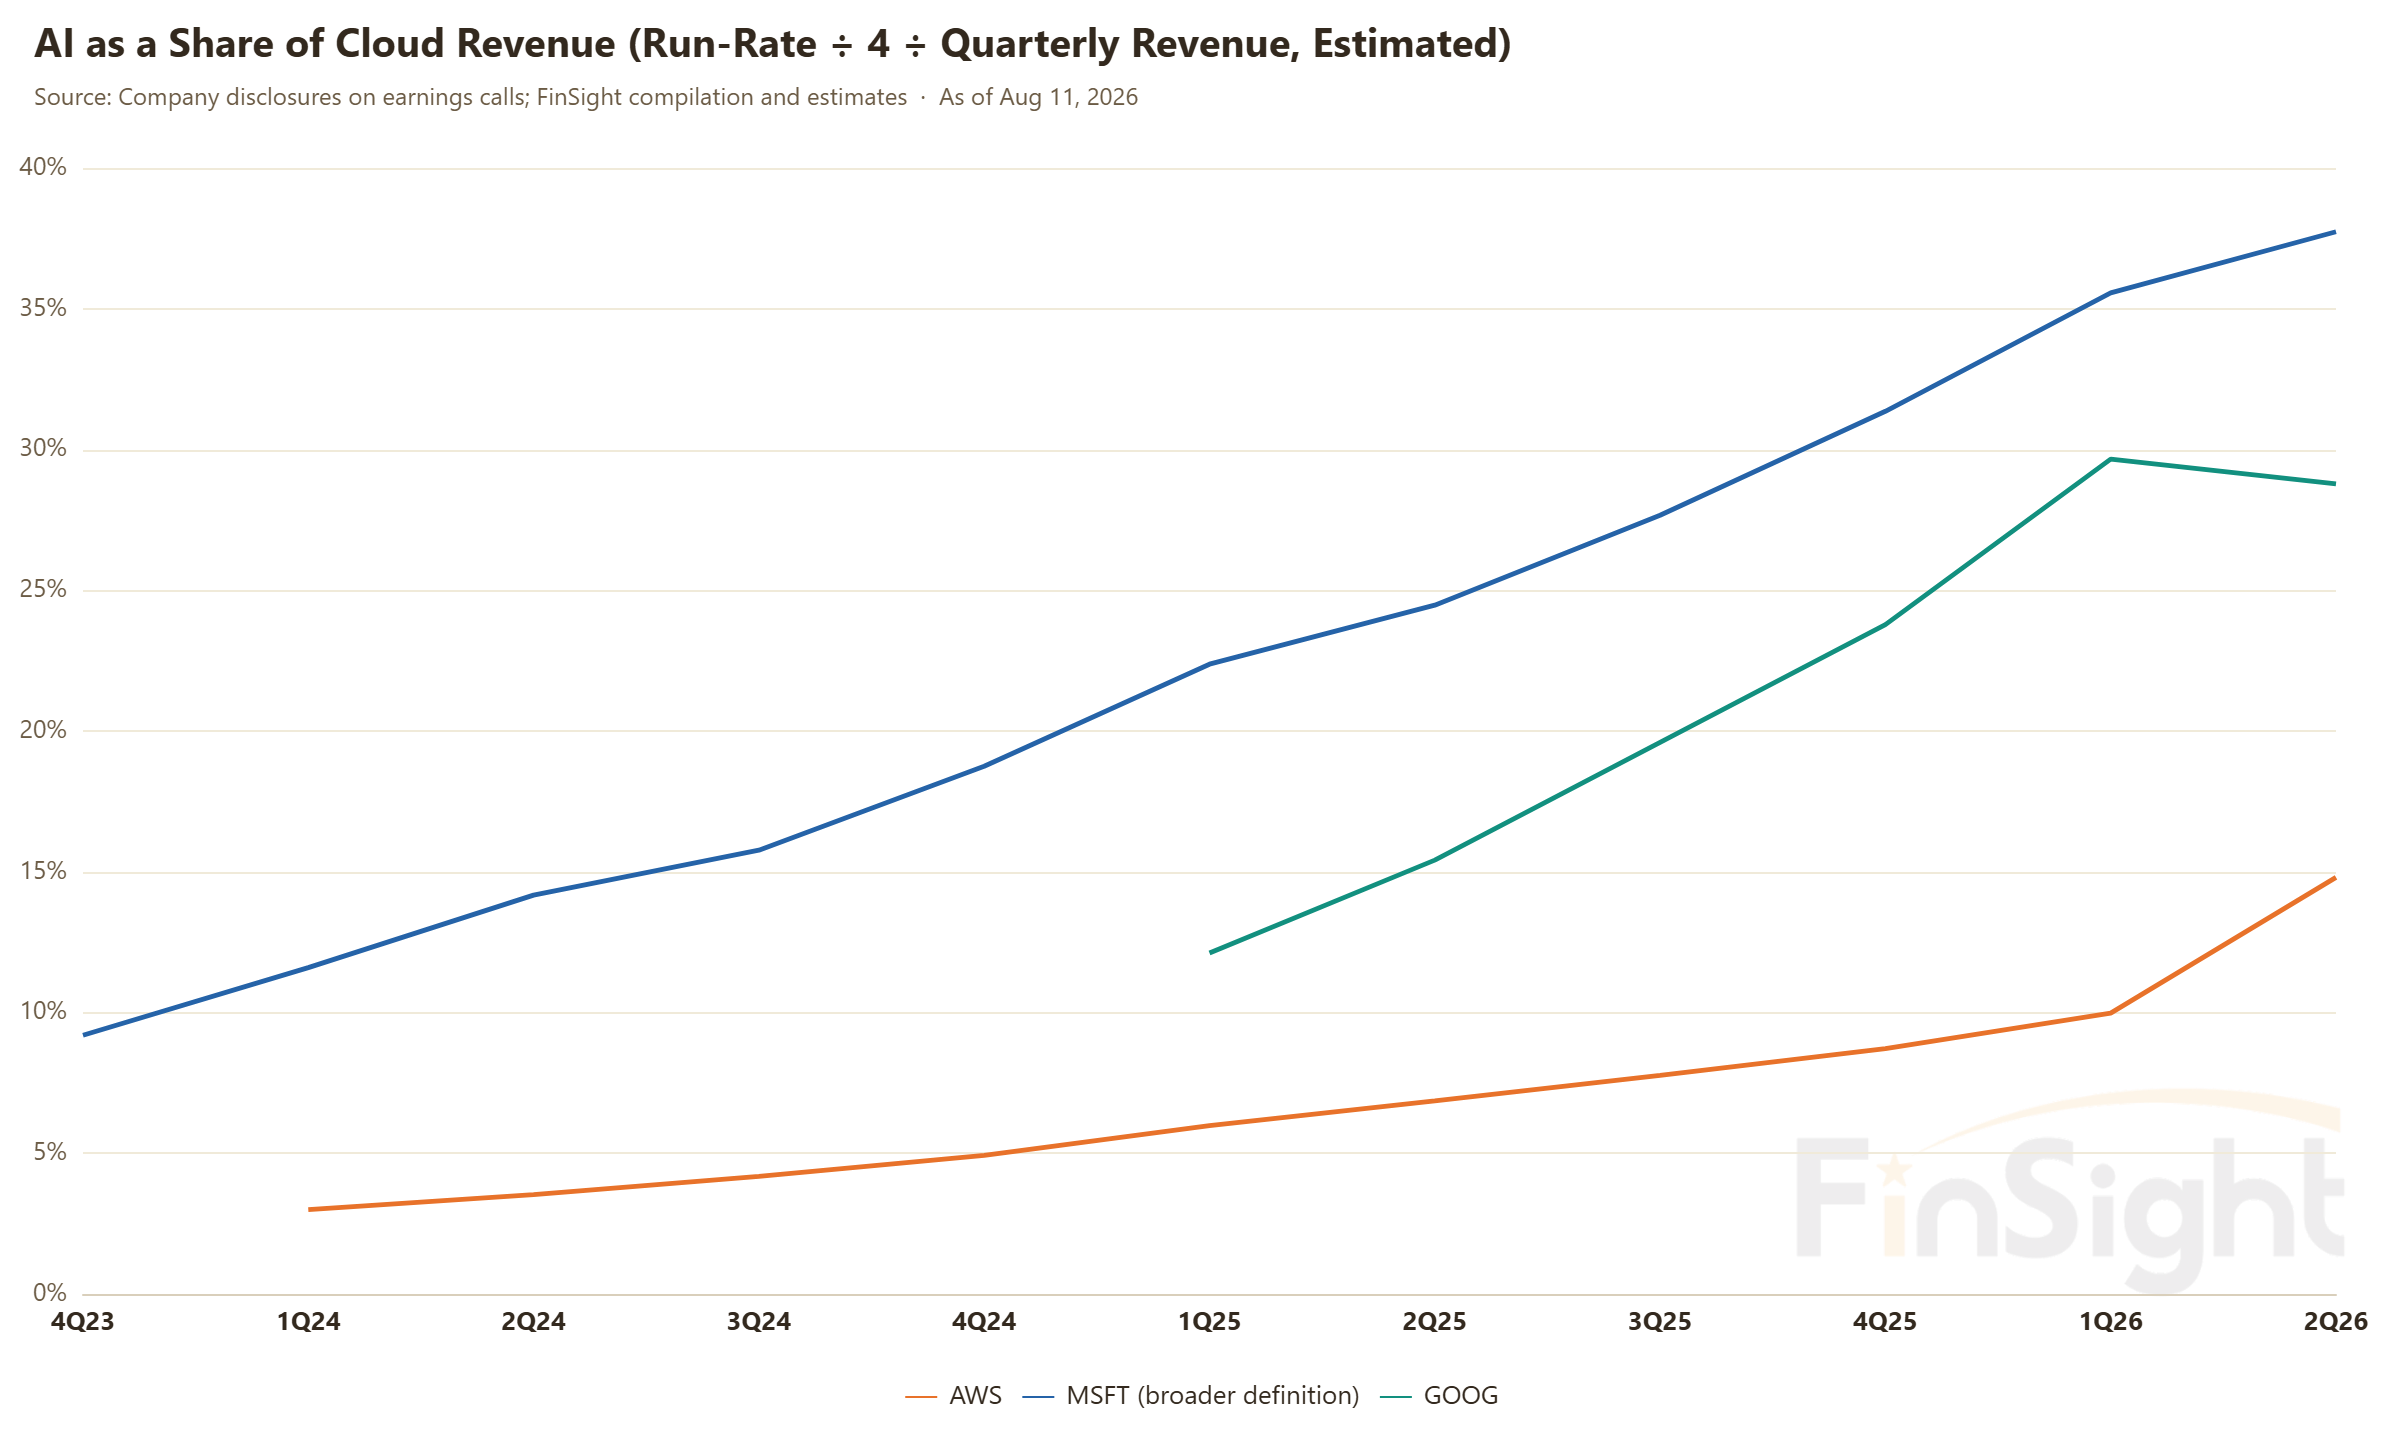
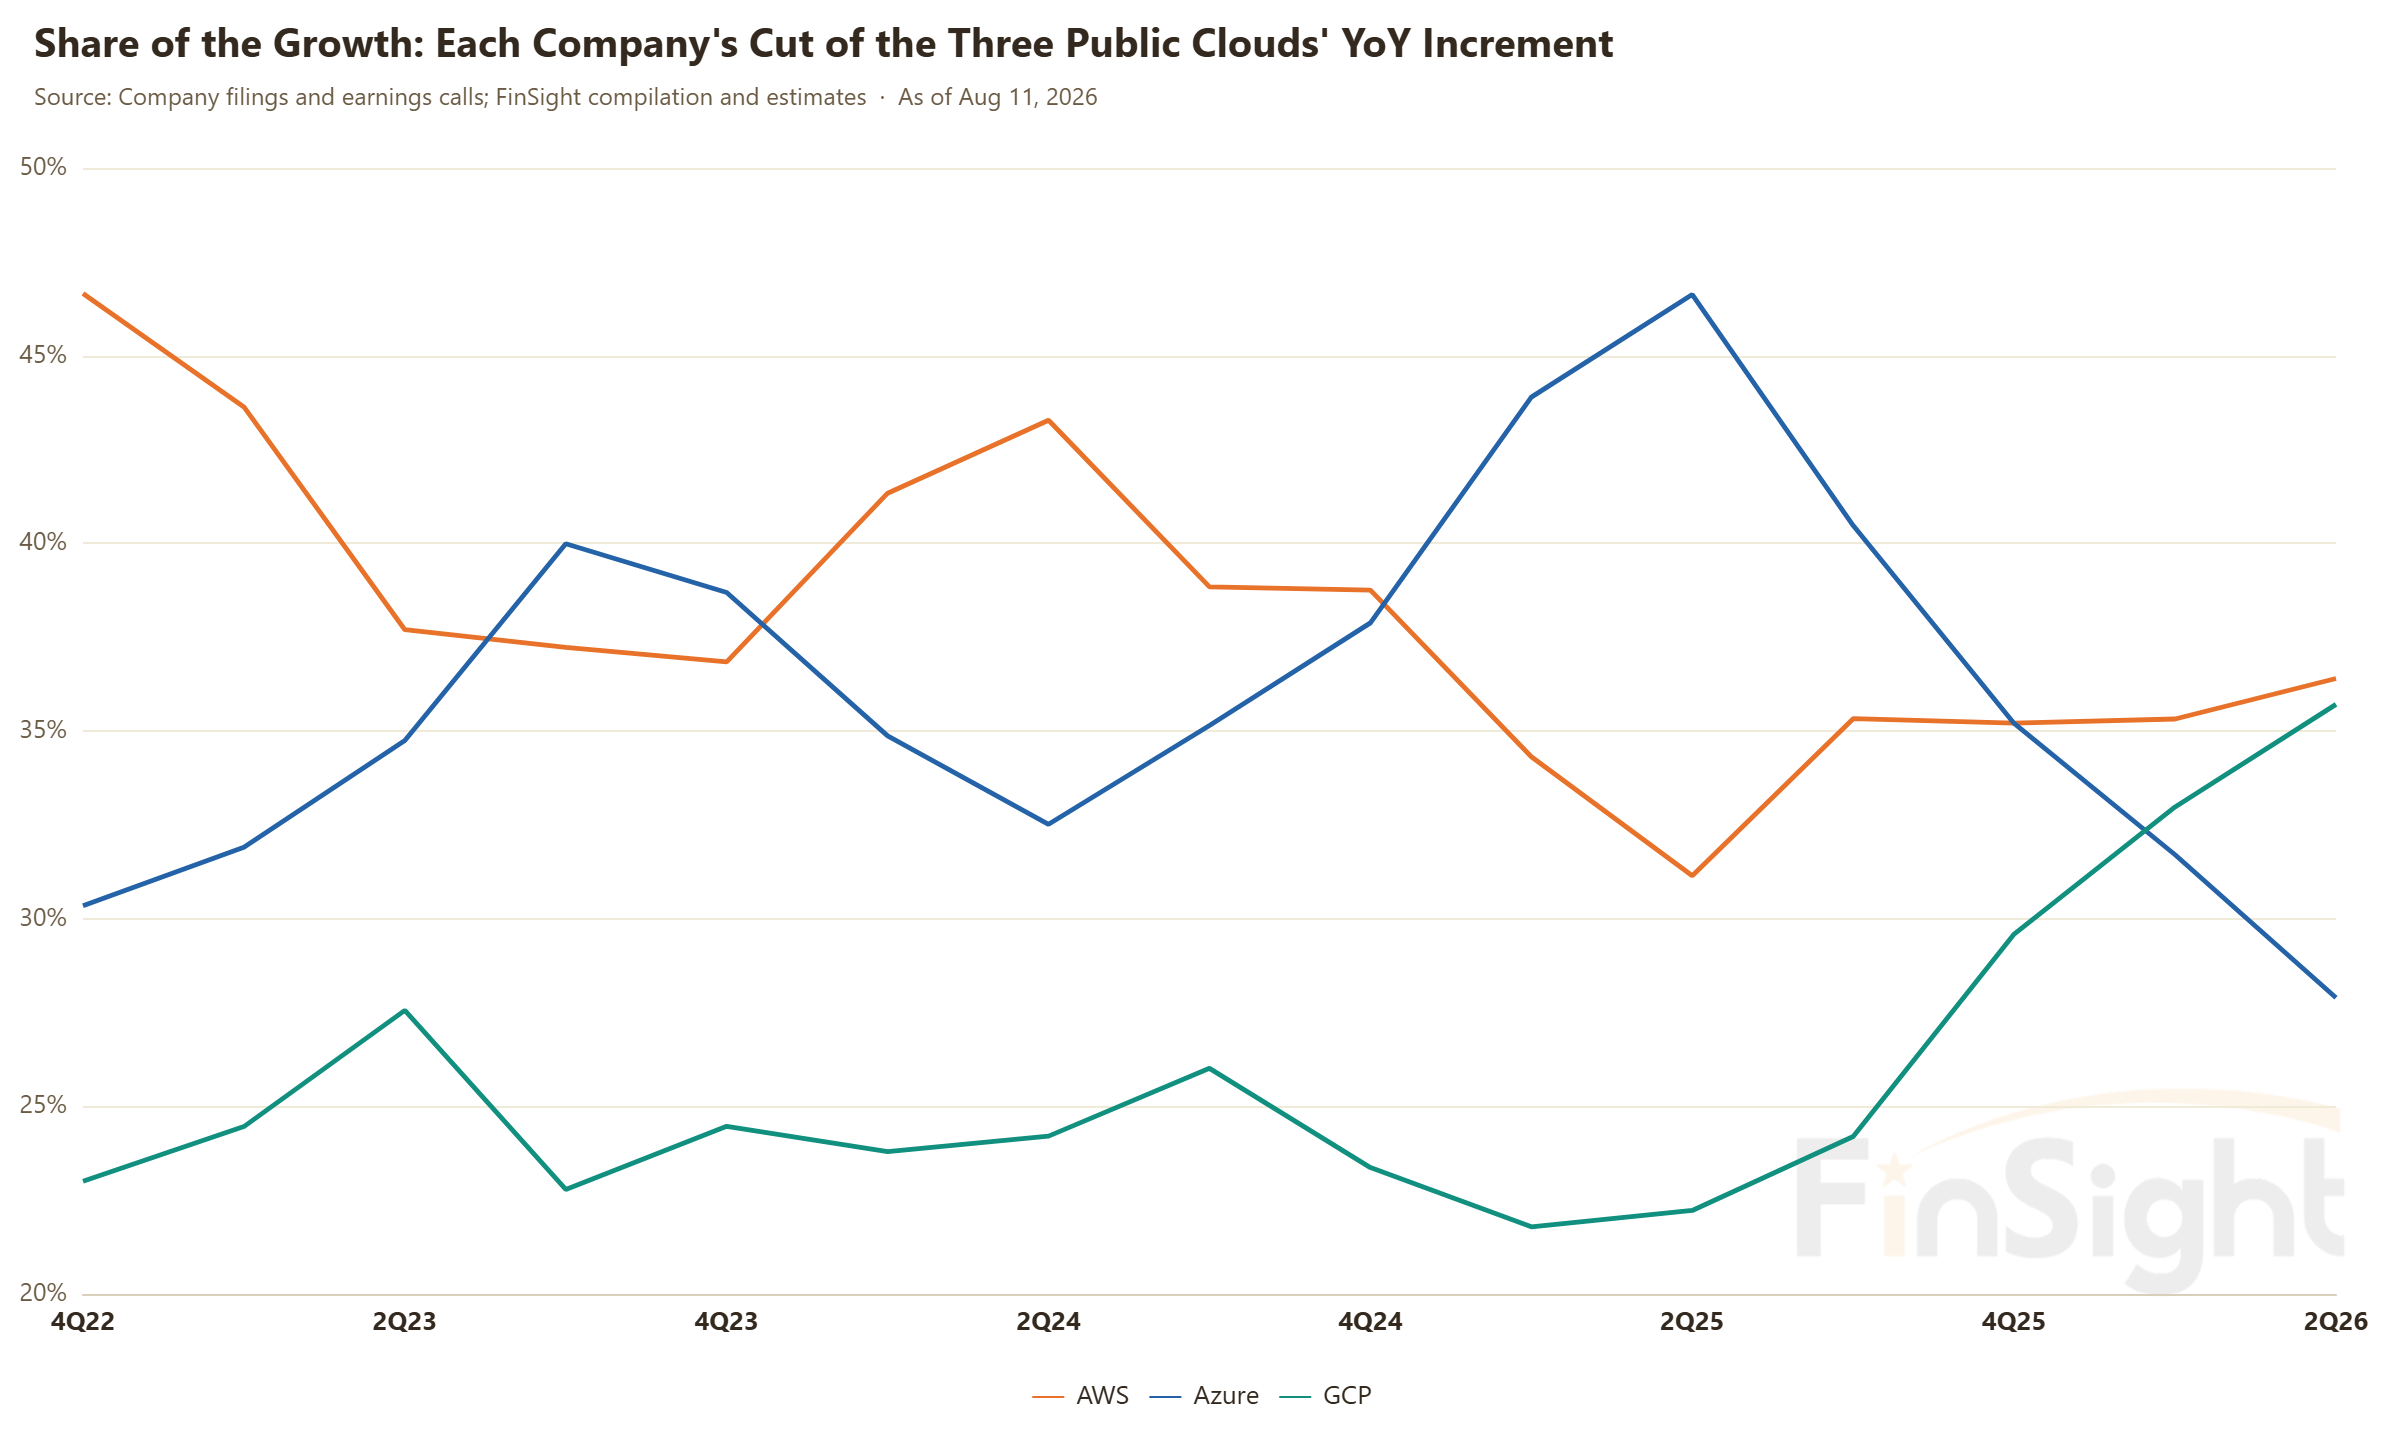
The share of the growth tells a good story too. In the third quarter of last year Google Cloud, the smallest of the three, briefly added more revenue in a quarter than AWS did, which is remarkable at its size. AWS did not stay behind for long. It put $10B of quarterly increment back on this quarter and took the lead again. The lead changing hands says the pie is growing fast enough for all three.
Two disclosures this quarter speak to the quality of that demand.
- Microsoft volunteered that close to 90% of cloud revenue comes from customers other than the frontier model companies, and that the entire sequential increase in RPO came from commitments outside the frontier labs. The demand is coming from the real economy.
- Amazon described the adoption curve as a barbell: labs and breakout apps burning enormous amounts of compute at one end, and a large body of enterprise workloads at the other where, in its words, most have not yet put inference into general use. Penetration is still early and the middle of the curve has not shown up.
How long the shortage lasts is where the language changed most this quarter.
Last quarter Microsoft said it expected to be short at least through the end of 2026. This quarter the same CFO stopped giving an end date and pointed at the market instead: demand keeps running ahead of available supply, and you can see it in the prices now showing up in the spot market for these assets. The old statement was that Microsoft did not have enough to sell. The new one is that the whole market is bidding up compute. Amazon pushed the timeline out furthest. Meta simply said its capital plan is built to maximize 2026 and 2027 capacity.
Andy Jassy: even spending $220B, Amazon cannot meet all the demand it already has for 2026, and he expects 2027 to look the same. The 2028 demand already in hand, he said, is striking. Most of 2027's capacity is effectively spoken for, and a meaningful amount of 2028 is booked as well.
Meta CFO Susan Li: the industry has historically underbuilt for this wave of AI adoption, which makes existing capacity, Meta's own included, extremely valuable. Compute in the near term is worth more than compute further out, so the plan is to maximize 2026 and 2027 capacity. For 2028 Meta is locking down land and power now and leaving the chip purchase decision for later.
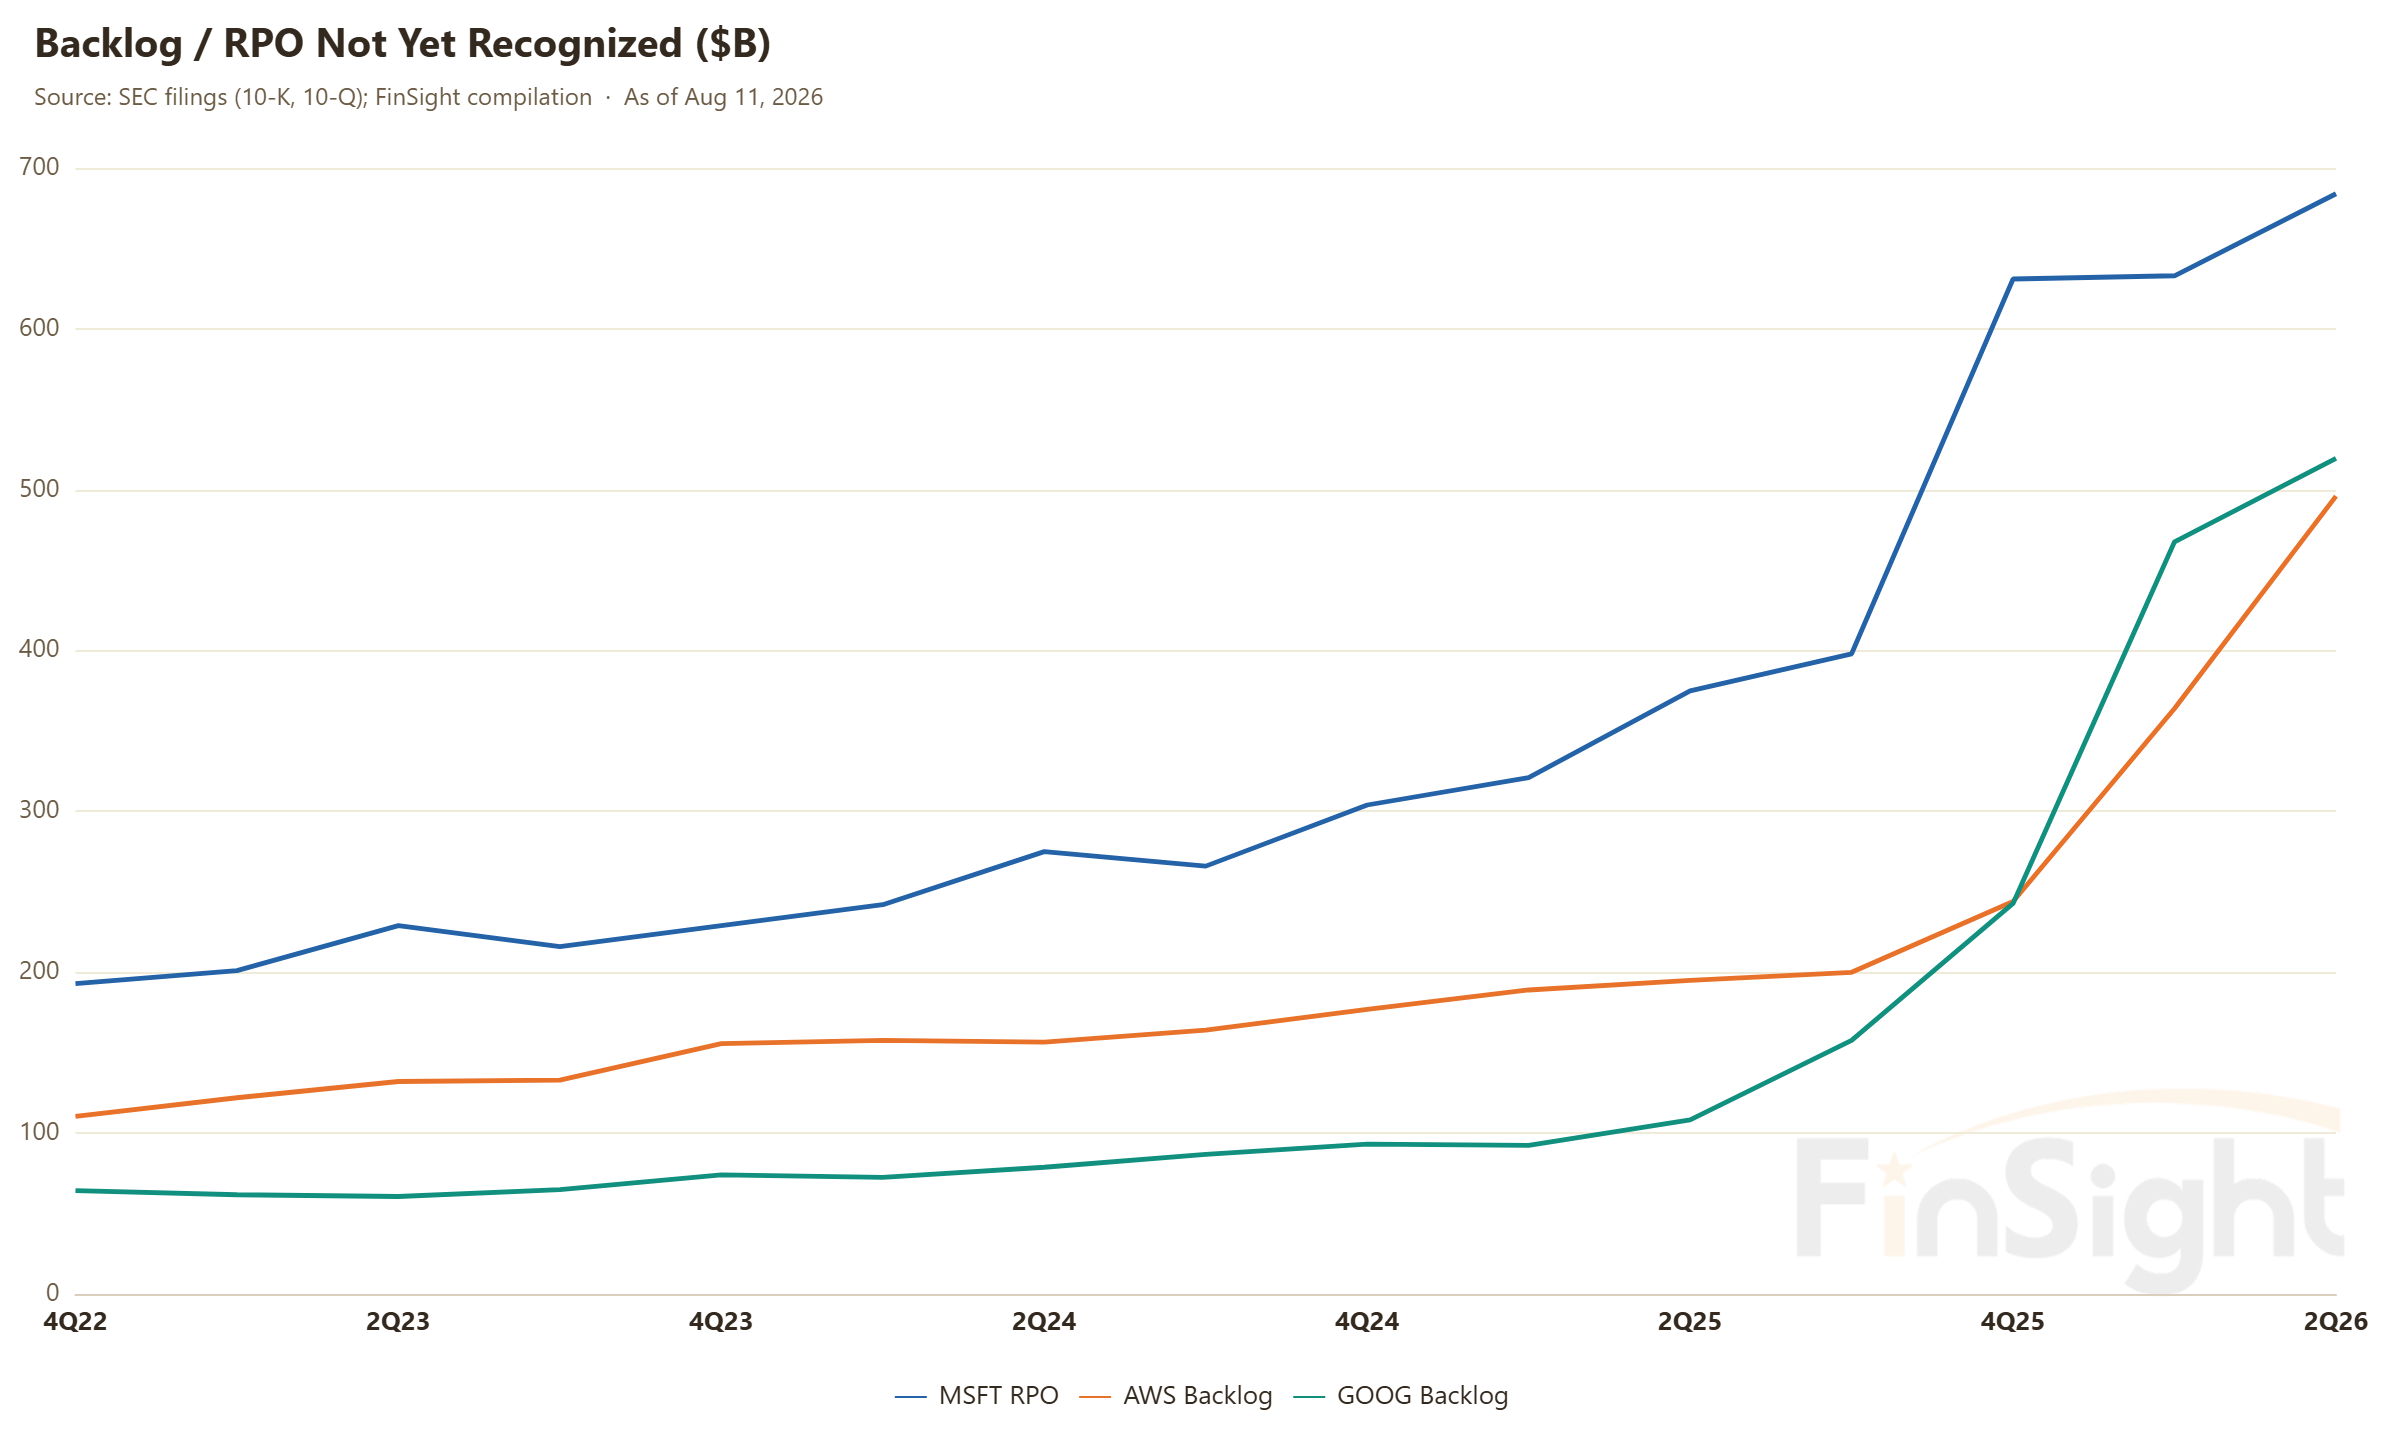
The order numbers back the talk. Microsoft's RPO is $678B, up 84%, and still up 25% with OpenAI stripped out. Google's is $514B, $50B of it added in the quarter. AWS is at $496B, up triple digits. These companies cannot spend money as fast as they are taking orders. Whose commitments those are, and how many circular deals sit inside them, deserves its own post.
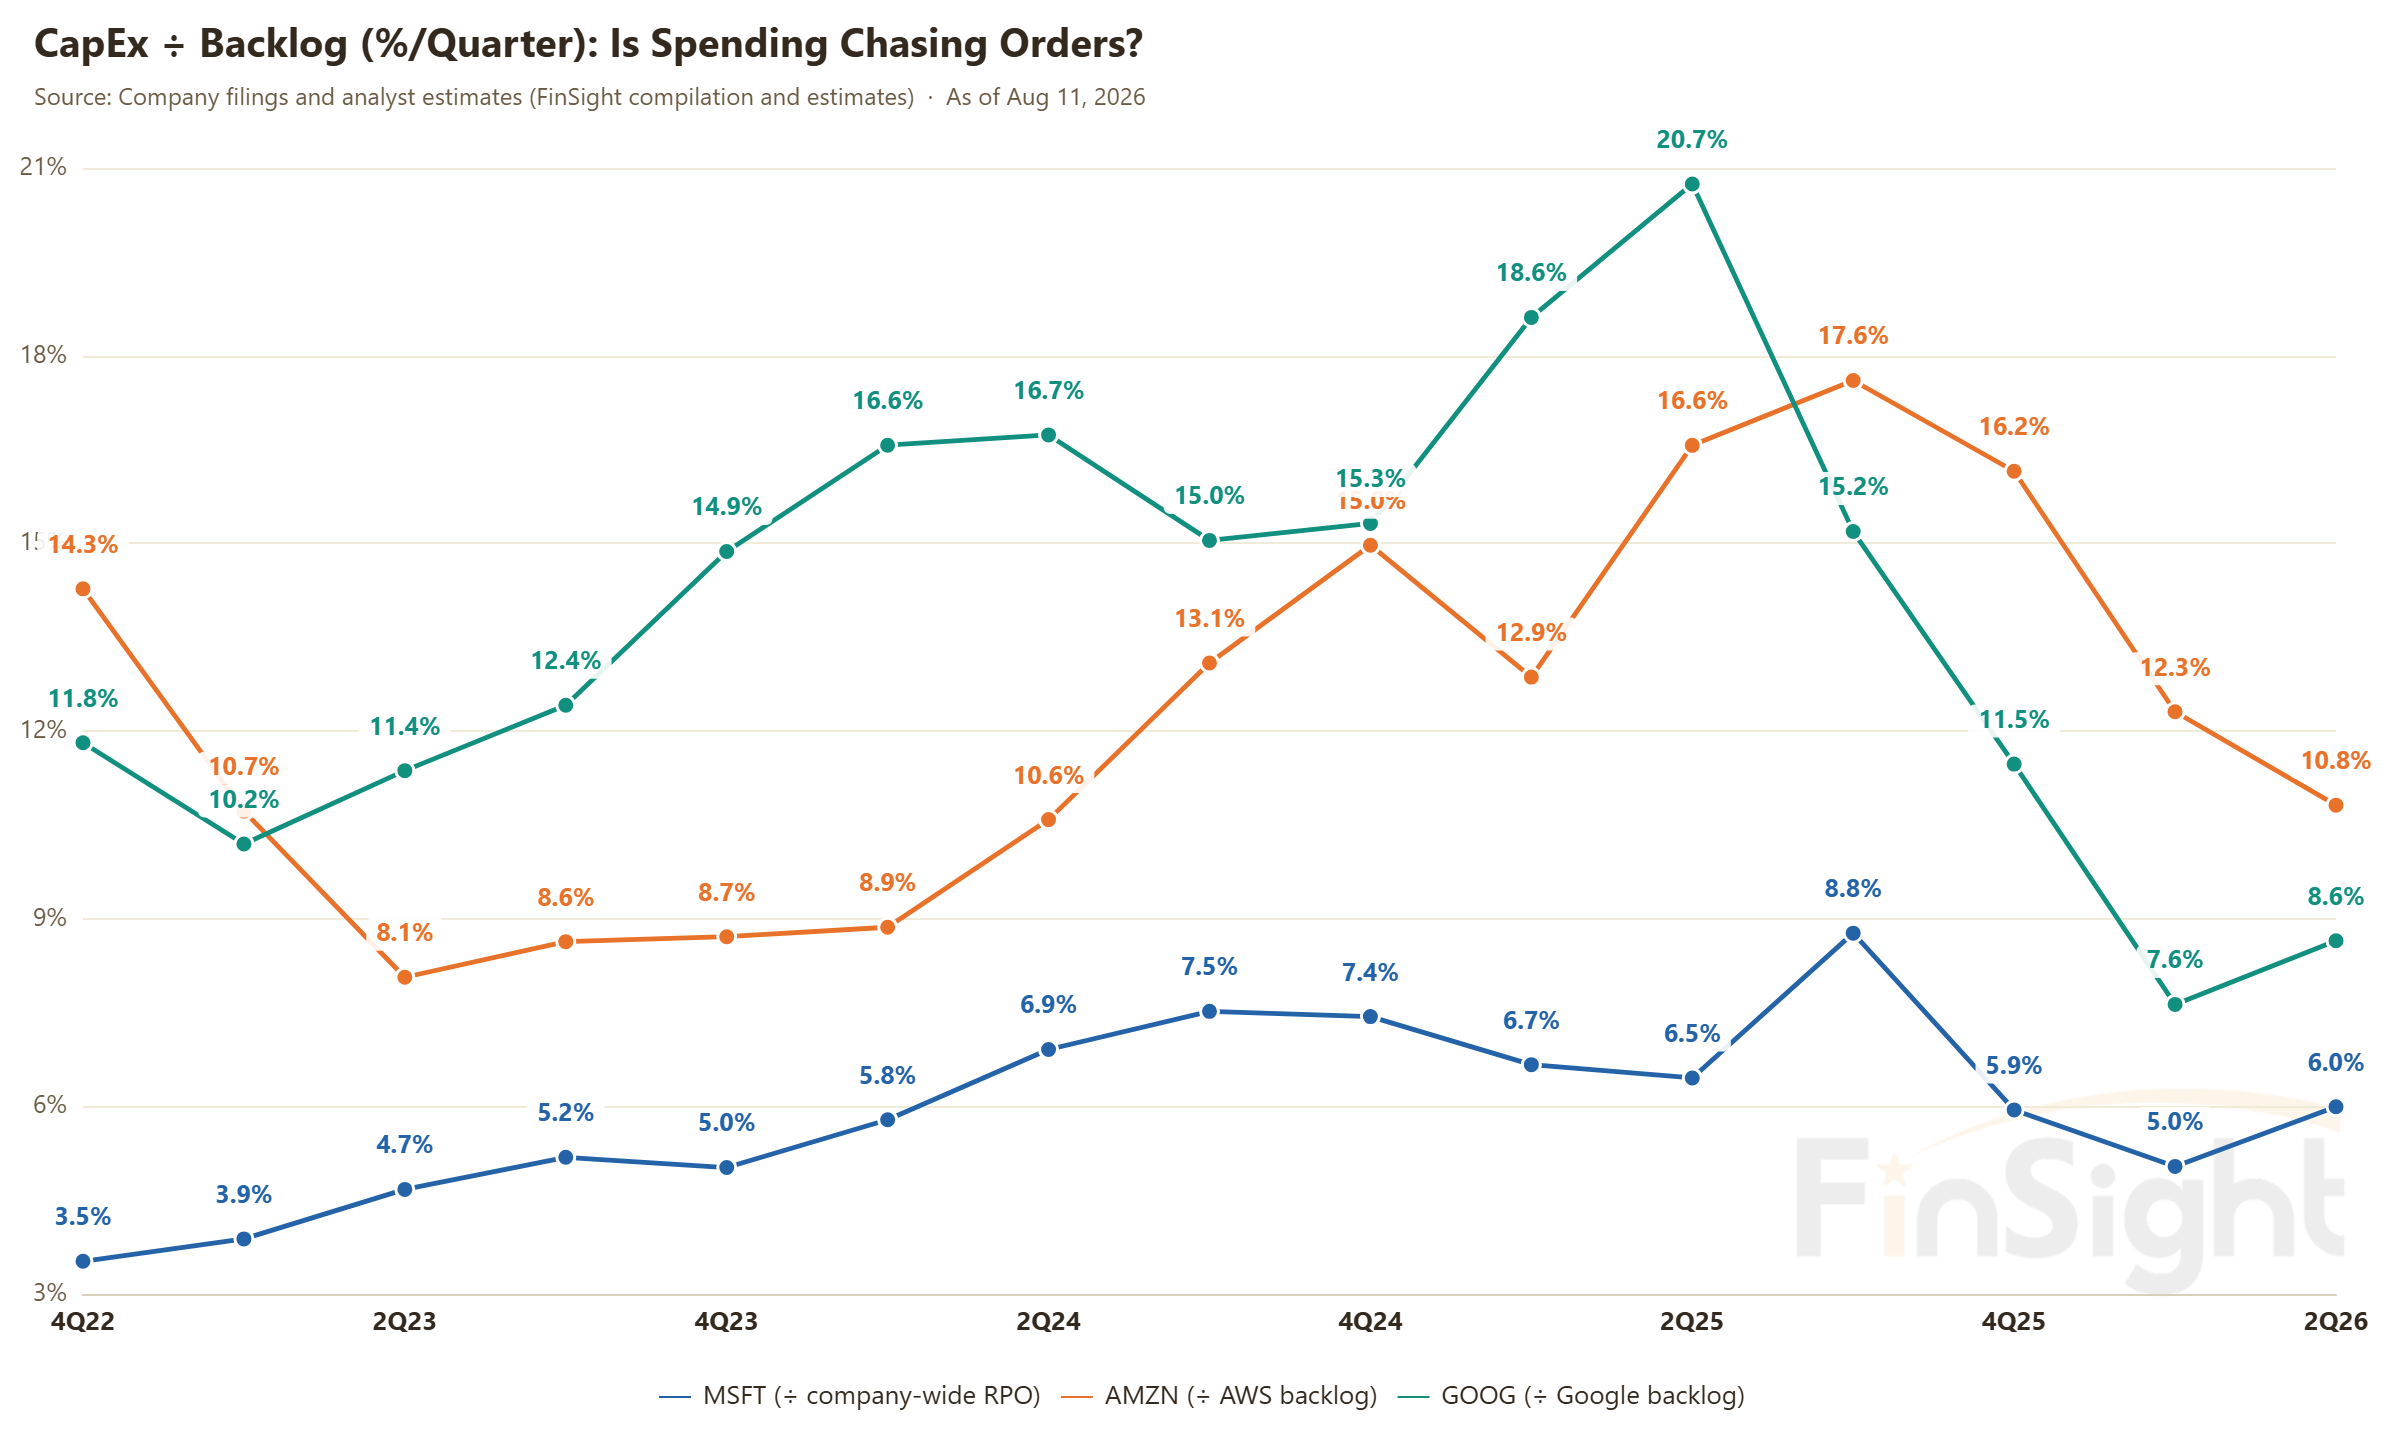
Check that against our July 17 post. We said mid-2027 would be the point with the least new capacity coming online and the tightest supply and demand. All four companies now describe a shortage that runs past 2027. Meta pushed capacity into 2026 and 2027 and kept 2028 flexible. That is our tightness timeline, drawn by a company with its own money on the line.
CapEx: all four raised, and Microsoft did not tap the brakes, it changed the accounting
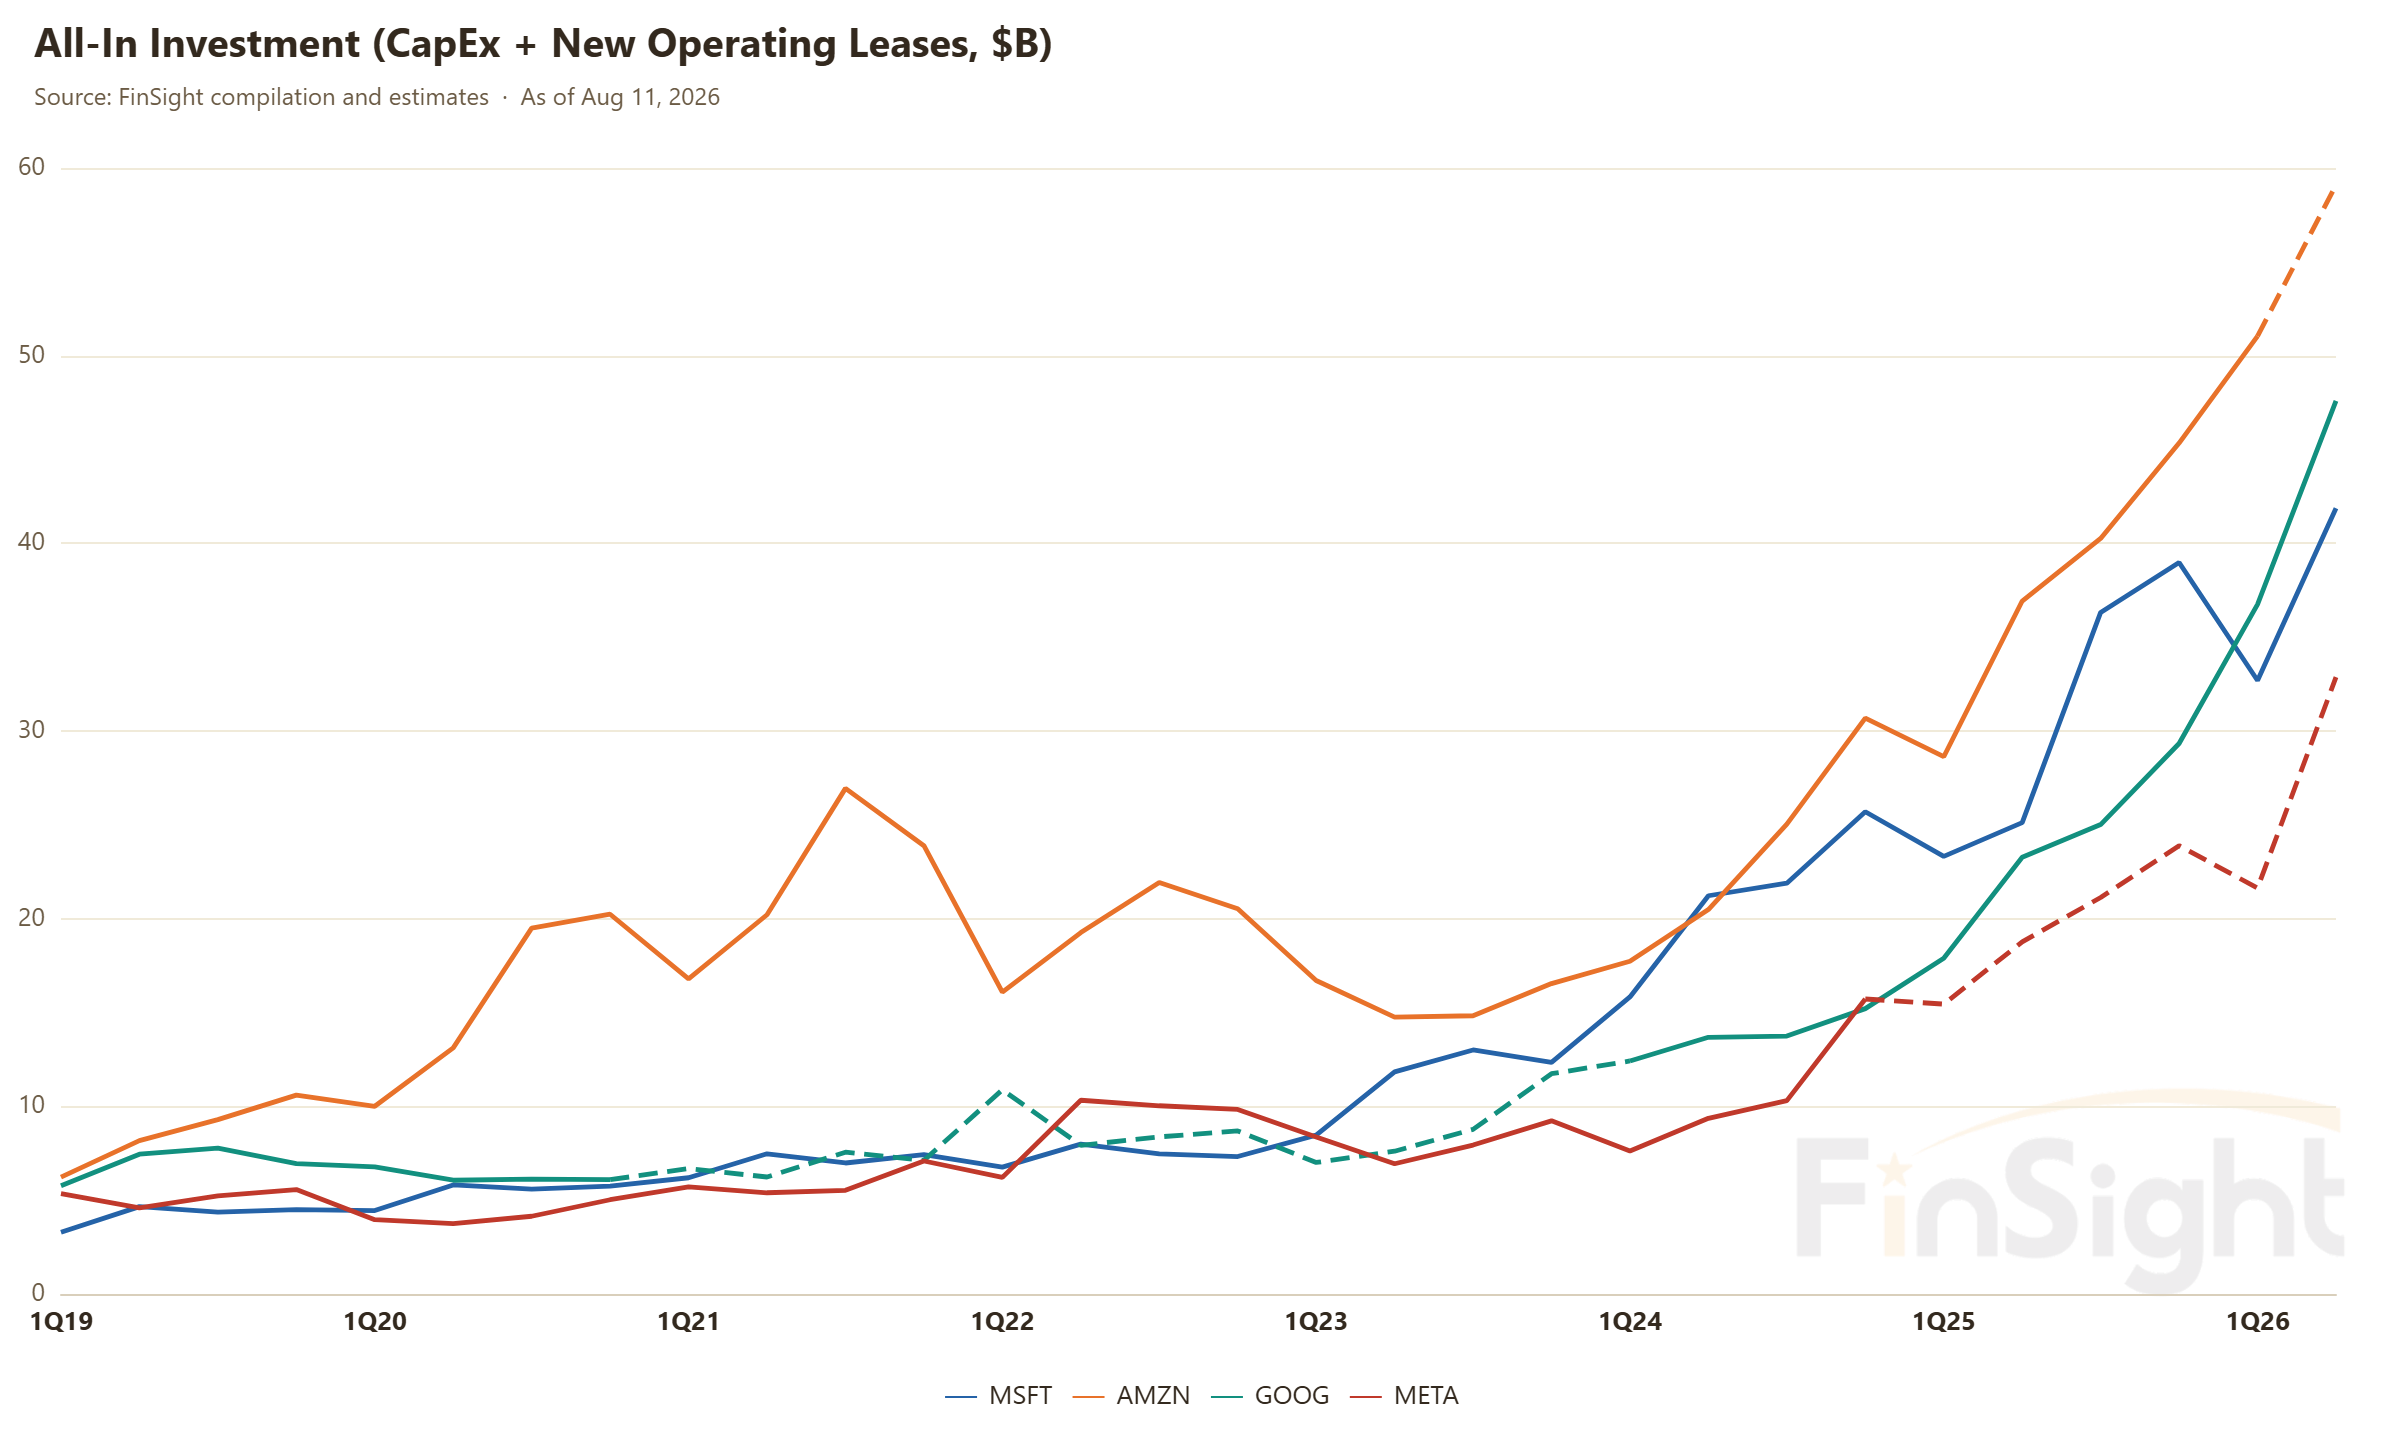
Real 2026 investment went up at every one of the four hyperscalers. Nobody is braking. The one that looks like a cut on paper, Microsoft, got a big rally out of it, and when you open it up the spending never came down. Microsoft extended the estimated useful life of its data centers from 15 years to 25, and moved more leases from finance to operating treatment, which takes them out of capital spending. That is how the reported number becomes roughly $175B. The company said plainly that excluding these effects, expected calendar 2026 investment is unchanged, and that FY27 goes up again. Not a dollar of investment came out. What came out is the part you can see on the face of the statements.
This is exactly what we argued before. As the lease share rises and more compute is contracted out, reported CapEx, meaning property and equipment, holds less and less of the real compute spend, and reading investment off the CapEx line gets more misleading every quarter. Microsoft is the first large sample. Same investment; change the lease classification, and a big piece disappears from the reported figure. So in this section we care less about the reported number and more about where the estimates are heading and what the commitment side is signaling.
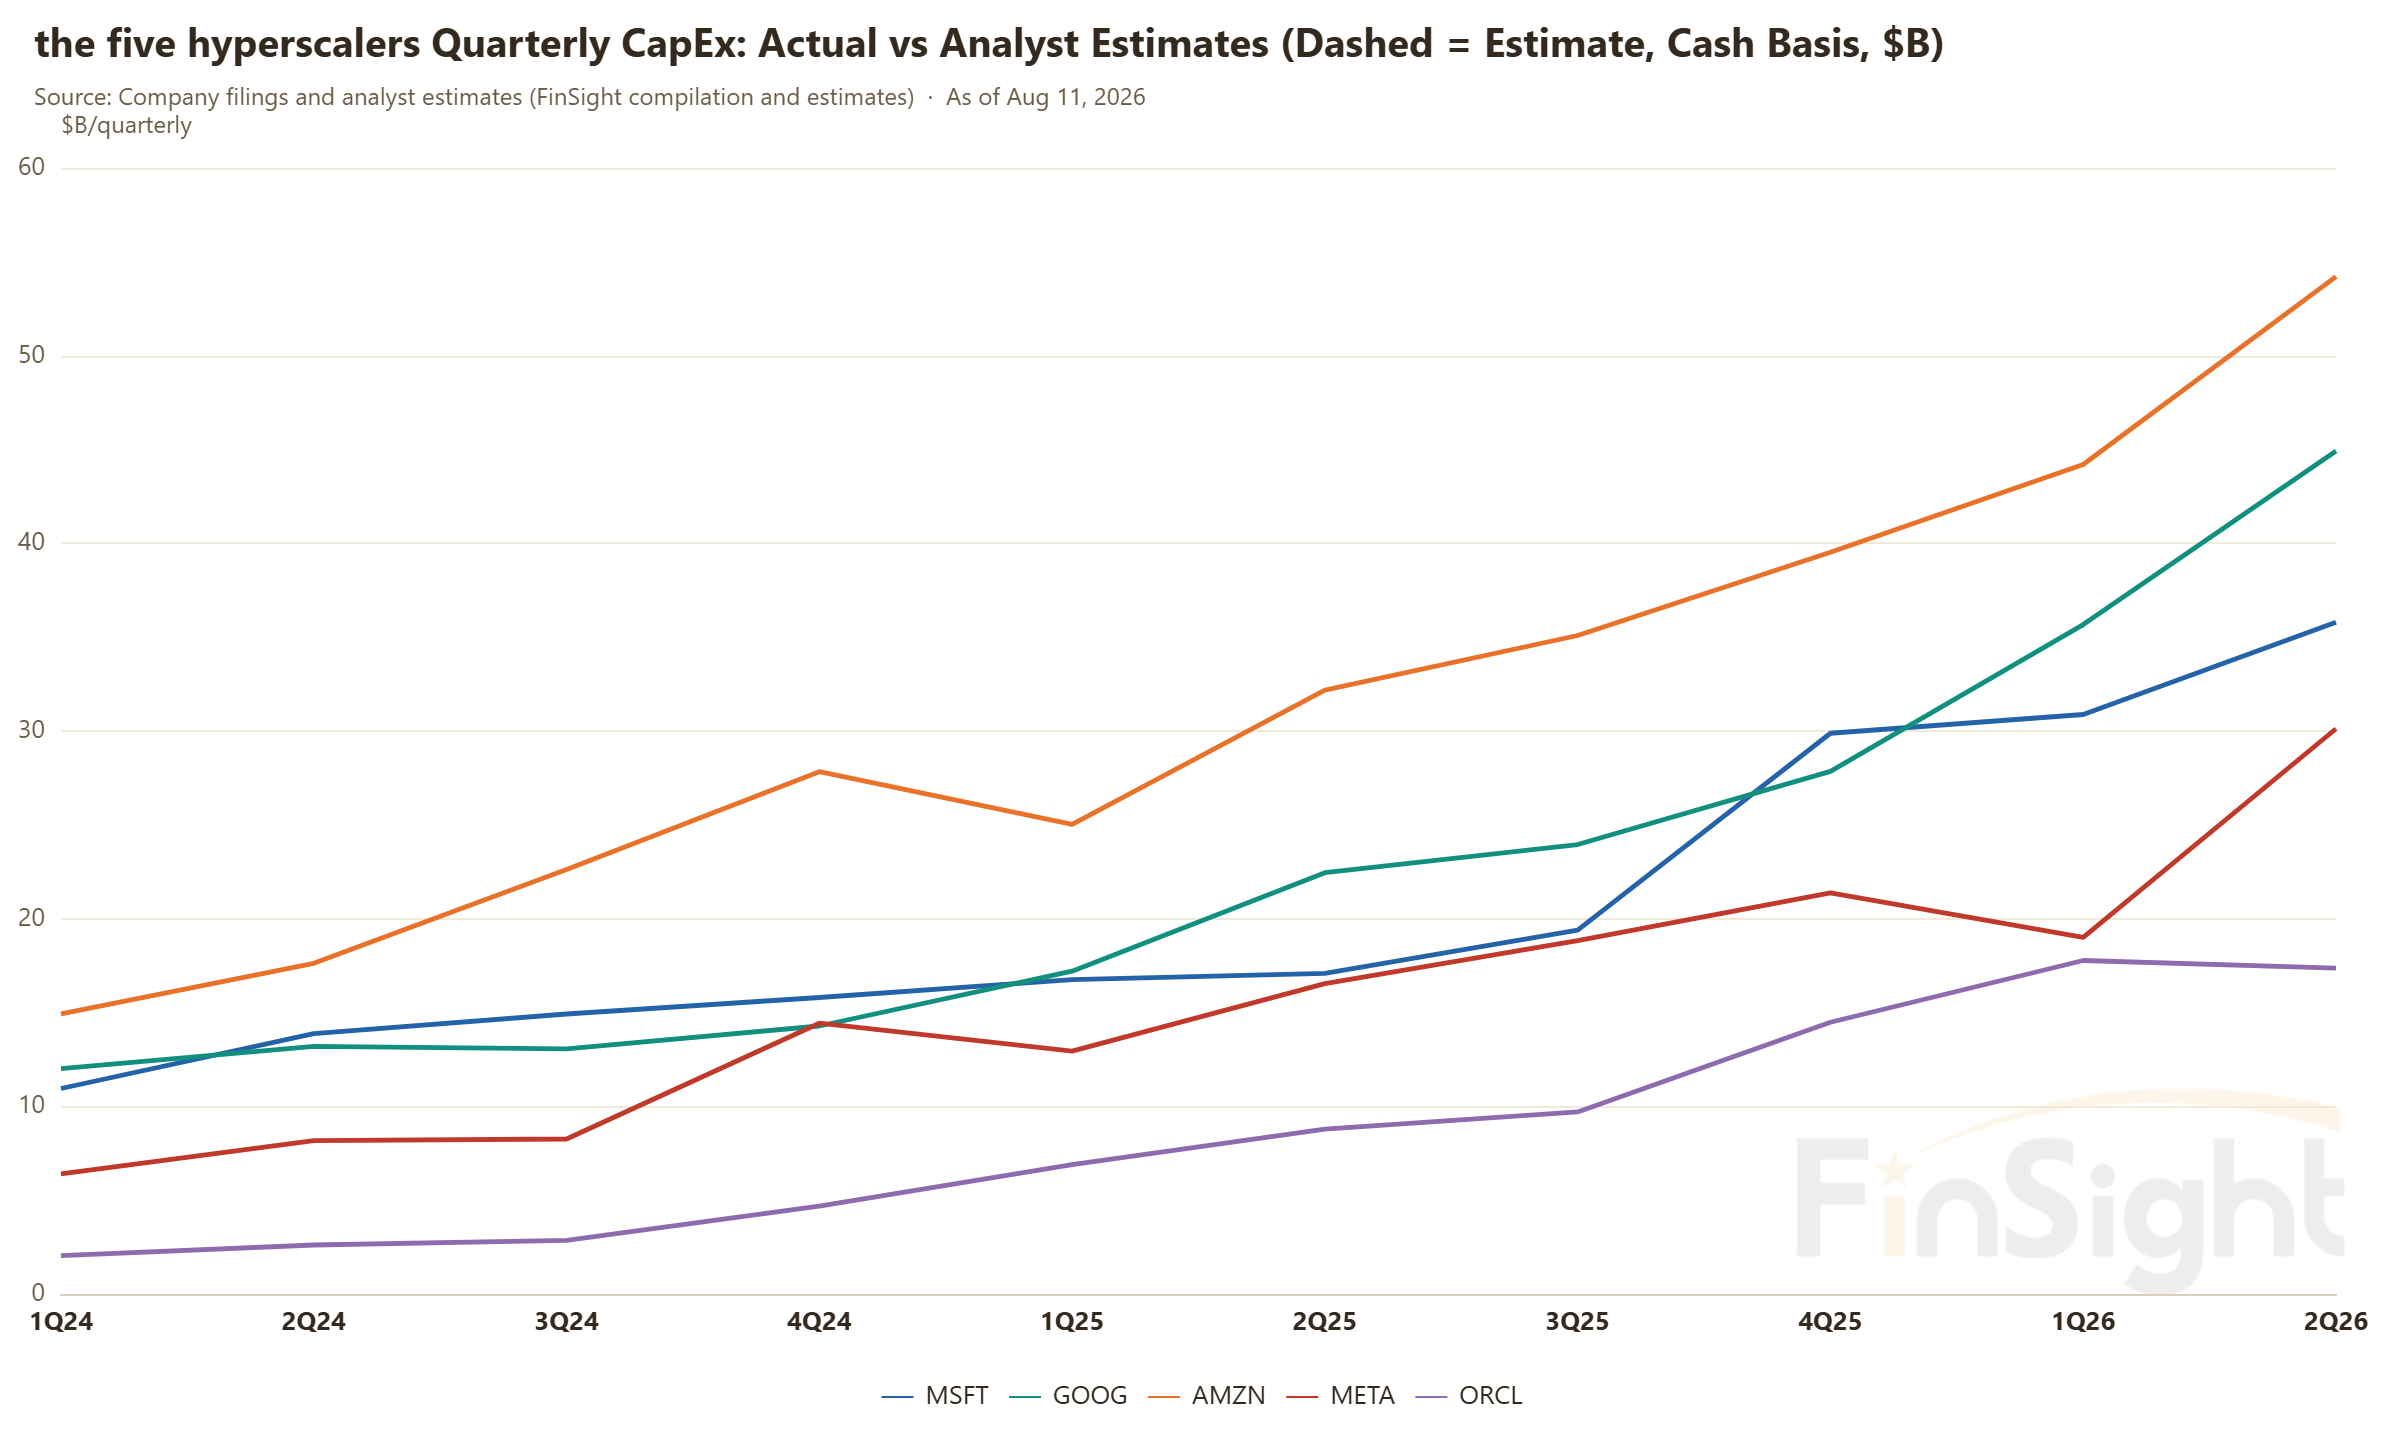
The other three raised outright. Google went from $180-190B to $195-205B, to pull capacity delivery forward, and said explicitly that 2027 goes up again. Amazon went from about $200B to about $220B, mostly because component prices are up rather than because there is much more compute in it. Meta lifted the bottom of its range to $130-145B.
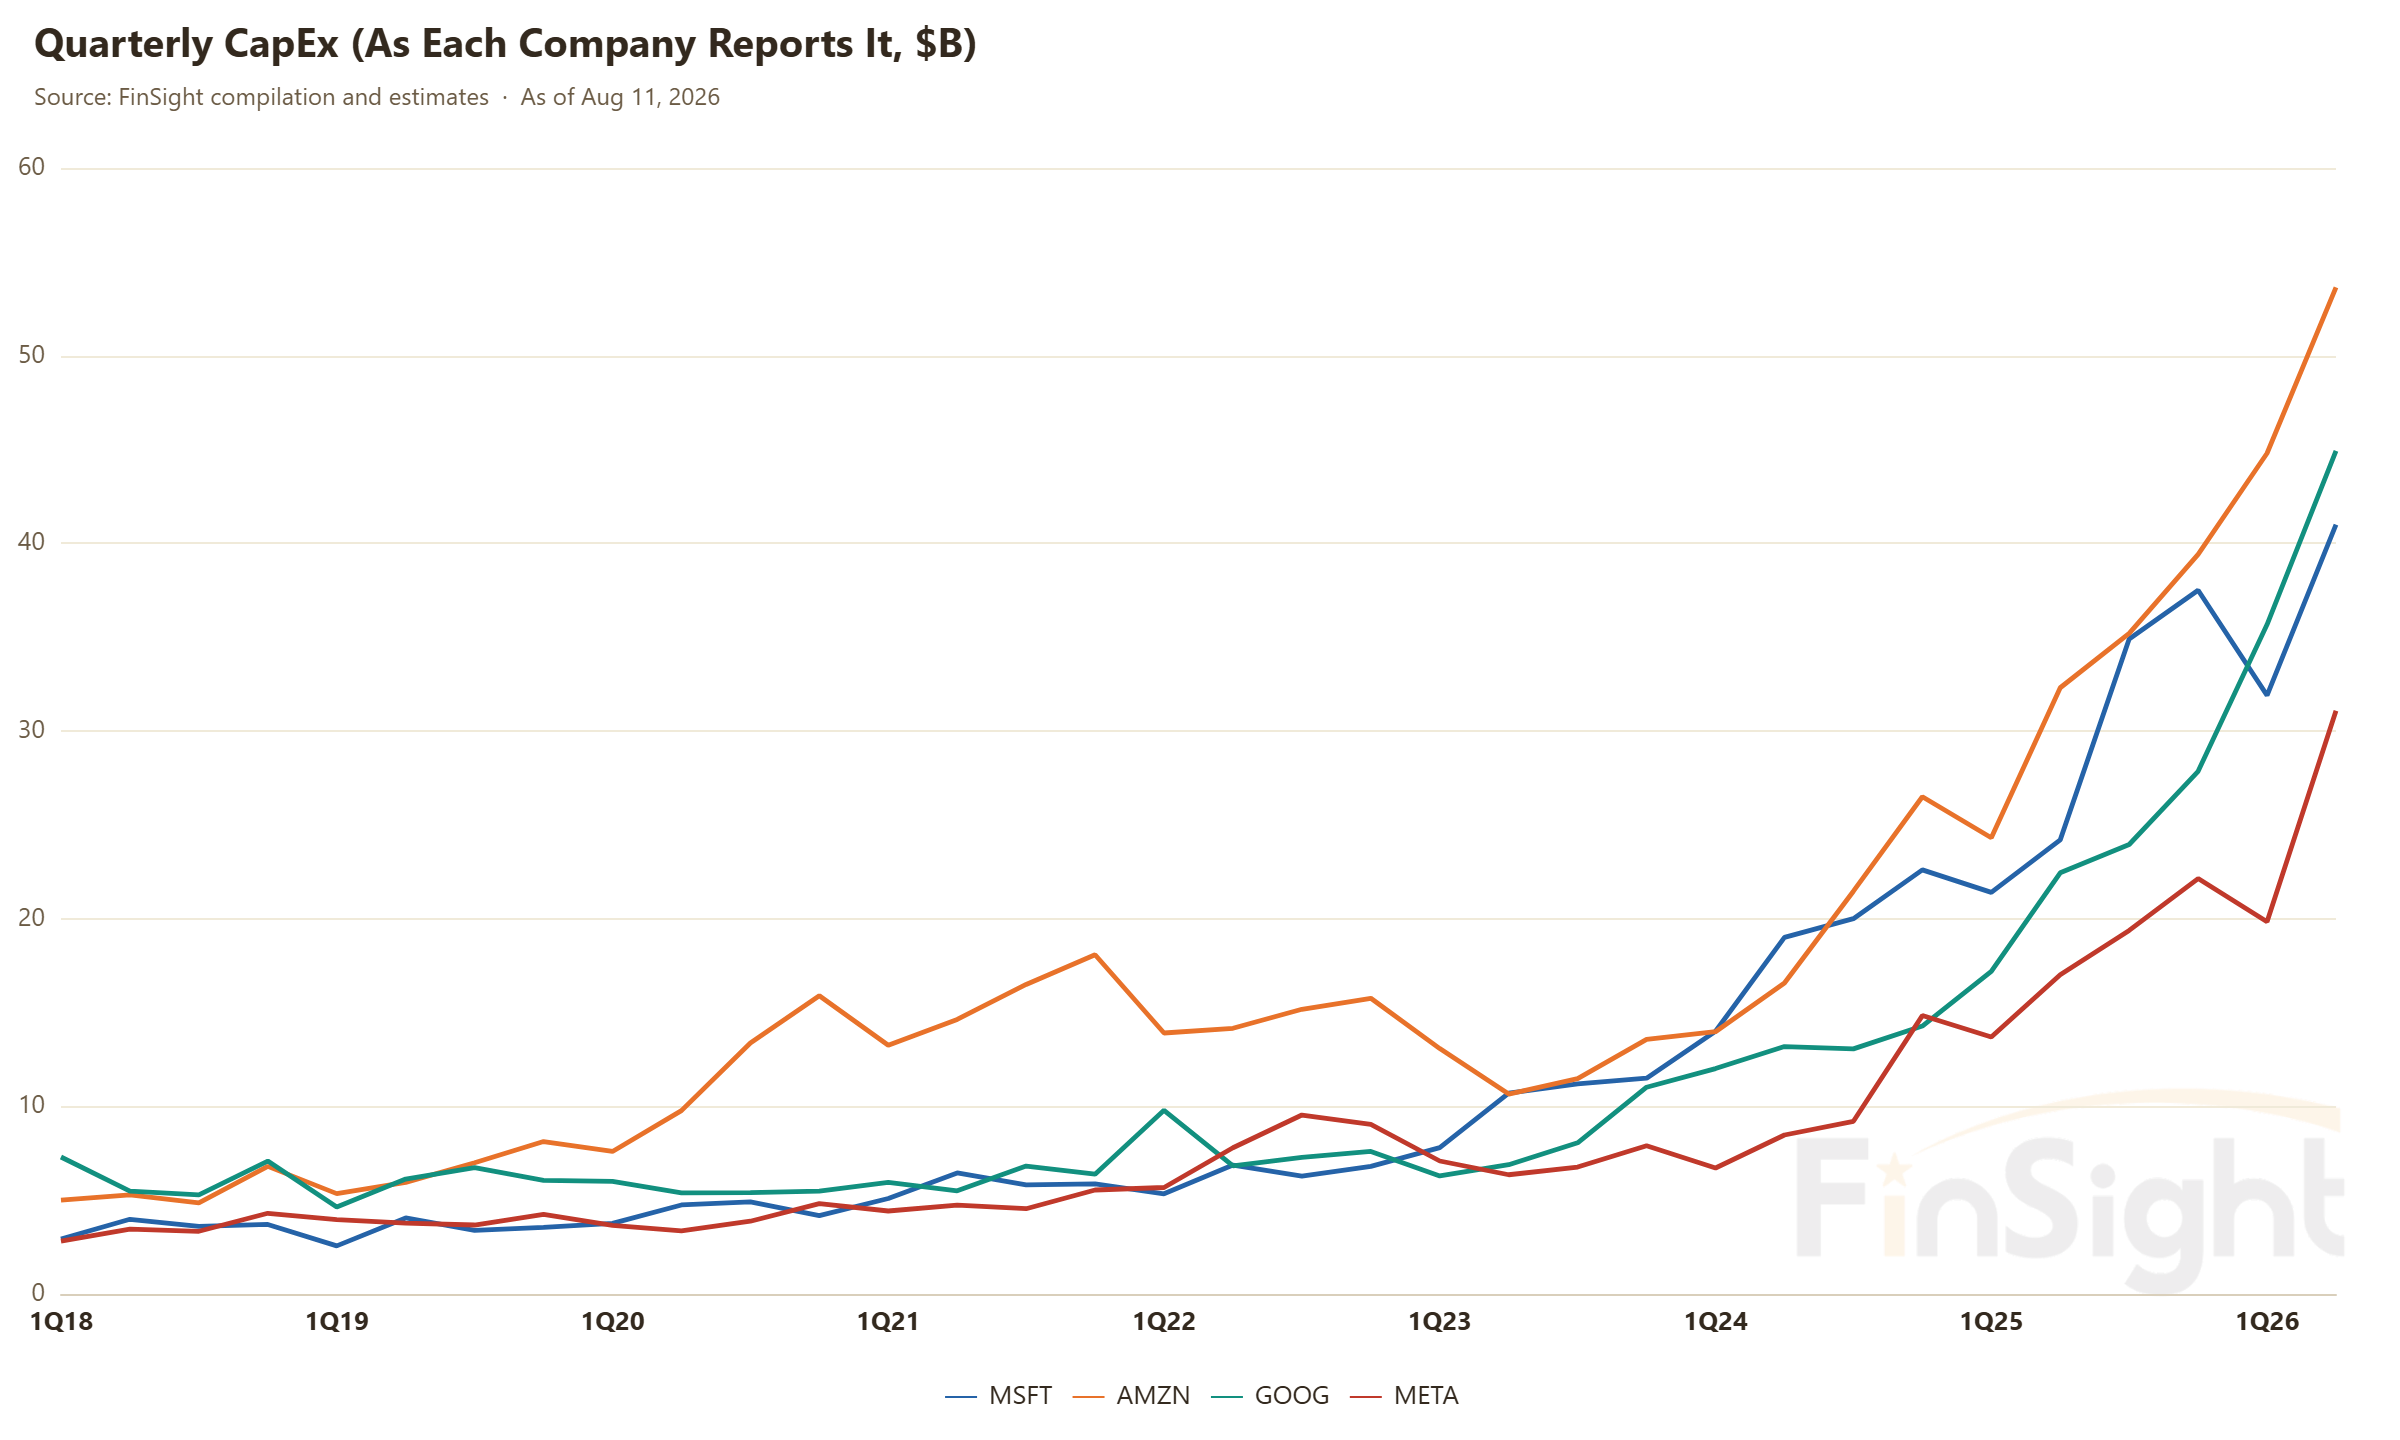
Amazon: it is no secret that memory, hard drive and SSD prices are going up.
Elon Musk, on the SpaceX call (xAI is now part of SpaceX): the binding constraint right now is memory. Memory output grows about 20% a year; demand is growing 200% a year or more. Demand is growing far faster than supply, and Econ 101 tells you the price goes up, not down.
The estimate path moves in one direction only. Over the past year the 2026 estimate for the five hyperscalers combined, the four plus Oracle, went from $445.6B to $797.1B. The 2027 estimate went from $489.5B to $1.118T, with 22.7% of that added in the last 90 days alone. In our August 3 post we backed into a 2027 bill of roughly $1.19T for the five hyperscalers, working from supply chain revenue. The gap between that and today's estimate may well close before the next round of earnings.
| 2025 | 2026E | 2027E | YoY 2026E | YoY 2027E | |
|---|---|---|---|---|---|
| Alphabet | 91,447 | 201,039 | 310,191 | +119.8% | +54.3% |
| Amazon | 131,819 | 220,363 | 282,983 | +67.2% | +28.4% |
| Meta | 69,691 | 138,996 | 219,551 | +99.4% | +58.0% |
| Microsoft | 83,094 | 157,982 | 204,020 | +90.1% | +29.1% |
| Oracle | 39,877 | 78,757 | 101,333 | +97.5% | +28.7% |
| Total | 415,928 | 797,138 | 1,118,078 | +91.7% | +40.3% |
Cash-basis capex. Oracle converted to calendar years.
Source: Analyst consensus (FinSight compilation)
| 360 days ago (Aug 12, 2025) | 270 days ago (Nov 10, 2025) | 180 days ago (Feb 8, 2026) | 90 days ago (May 9, 2026) | Now (Aug 7, 2026) | |
|---|---|---|---|---|---|
| 2026E: Alphabet | 98,293 | 127,061 | 183,181 | 186,590 | 201,039 |
| 2026E: Amazon | 128,893 | 146,390 | 190,024 | 199,518 | 220,363 |
| 2026E: Meta | 99,366 | 110,847 | 125,054 | 133,869 | 138,996 |
| 2026E: Microsoft | 90,918 | 106,381 | 114,101 | 160,945 | 157,982 |
| 2026E: Oracle | 28,151 | 43,499 | 57,229 | 59,569 | 78,757 |
| 2026E: Total | 445,621 | 534,178 | 669,588 | 740,492 | 797,138 |
| 2026E: change vs prior column | +19.9% | +25.3% | +10.6% | +7.6% | |
| 2027E: Alphabet | 102,854 | 137,181 | 200,190 | 243,714 | 310,191 |
| 2027E: Amazon | 146,121 | 170,887 | 229,169 | 230,627 | 282,983 |
| 2027E: Meta | 106,086 | 123,369 | 153,179 | 173,195 | 219,551 |
| 2027E: Microsoft | 102,519 | 121,126 | 133,740 | 187,568 | 204,020 |
| 2027E: Oracle | 31,942 | 63,847 | 67,247 | 76,458 | 101,333 |
| 2027E: Total | 489,521 | 616,410 | 783,525 | 911,561 | 1,118,078 |
| 2027E: change vs prior column | +25.9% | +27.1% | +16.3% | +22.7% |
Cash-basis capex for Microsoft, Alphabet, Amazon, Meta and Oracle. Each column is the consensus estimate on that date.
Source: Analyst consensus (FinSight compilation)
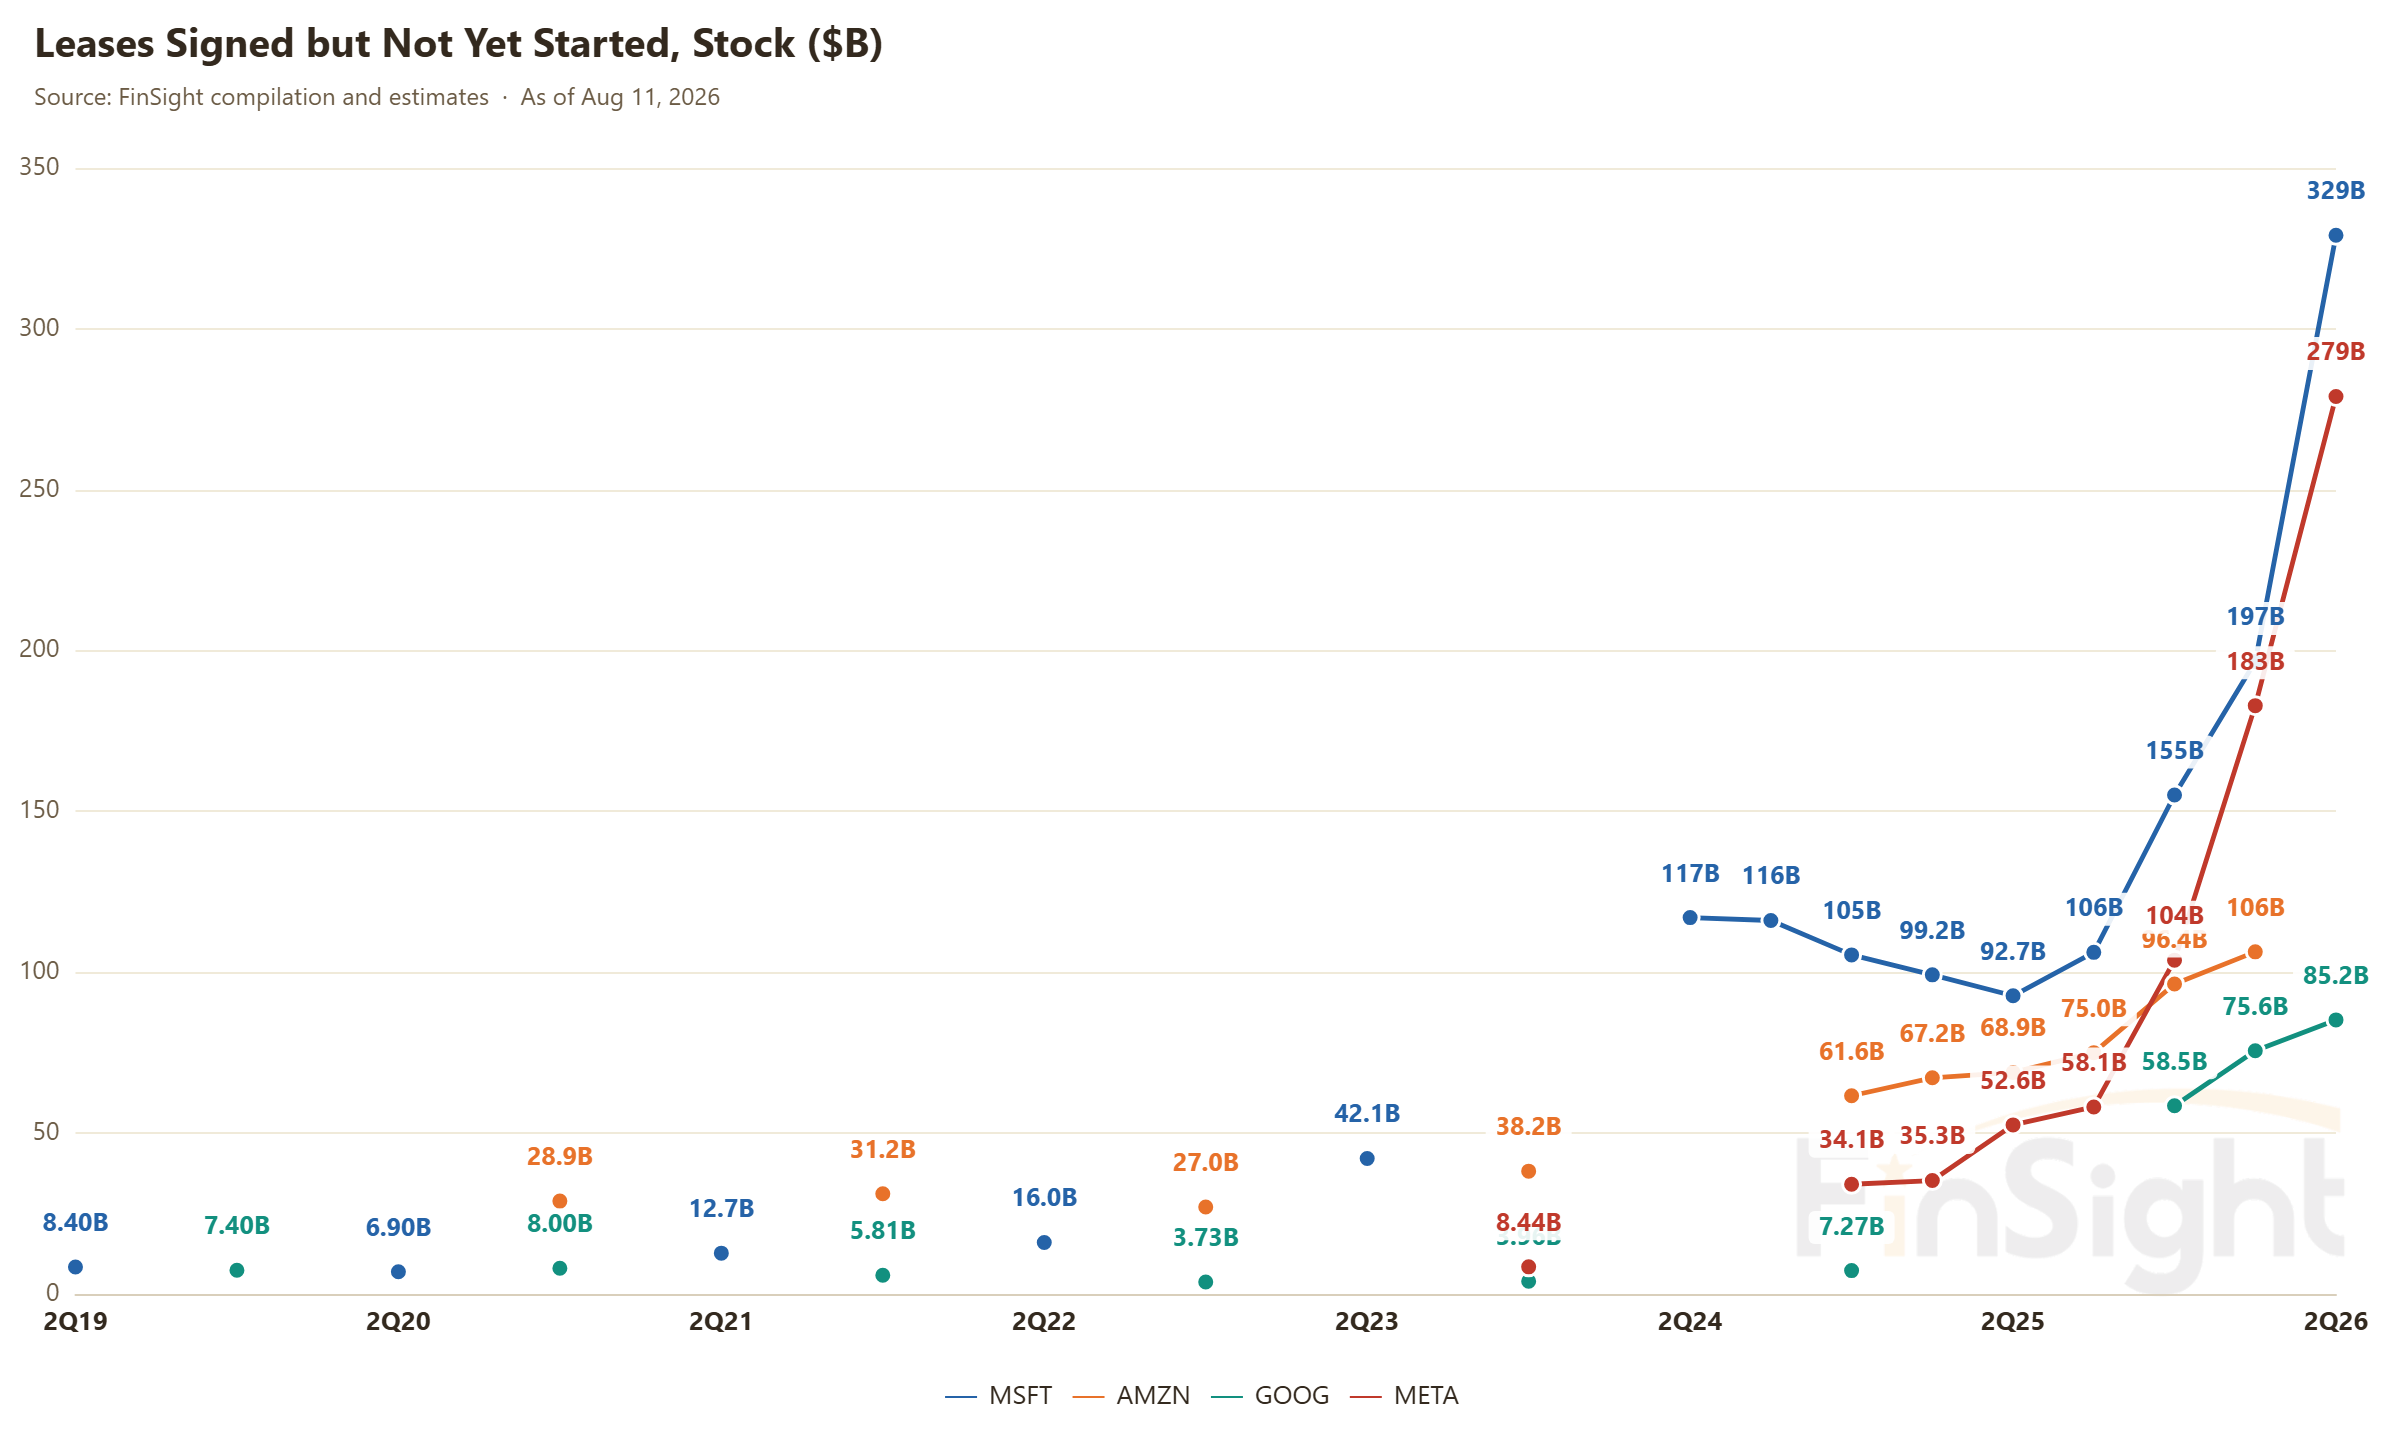
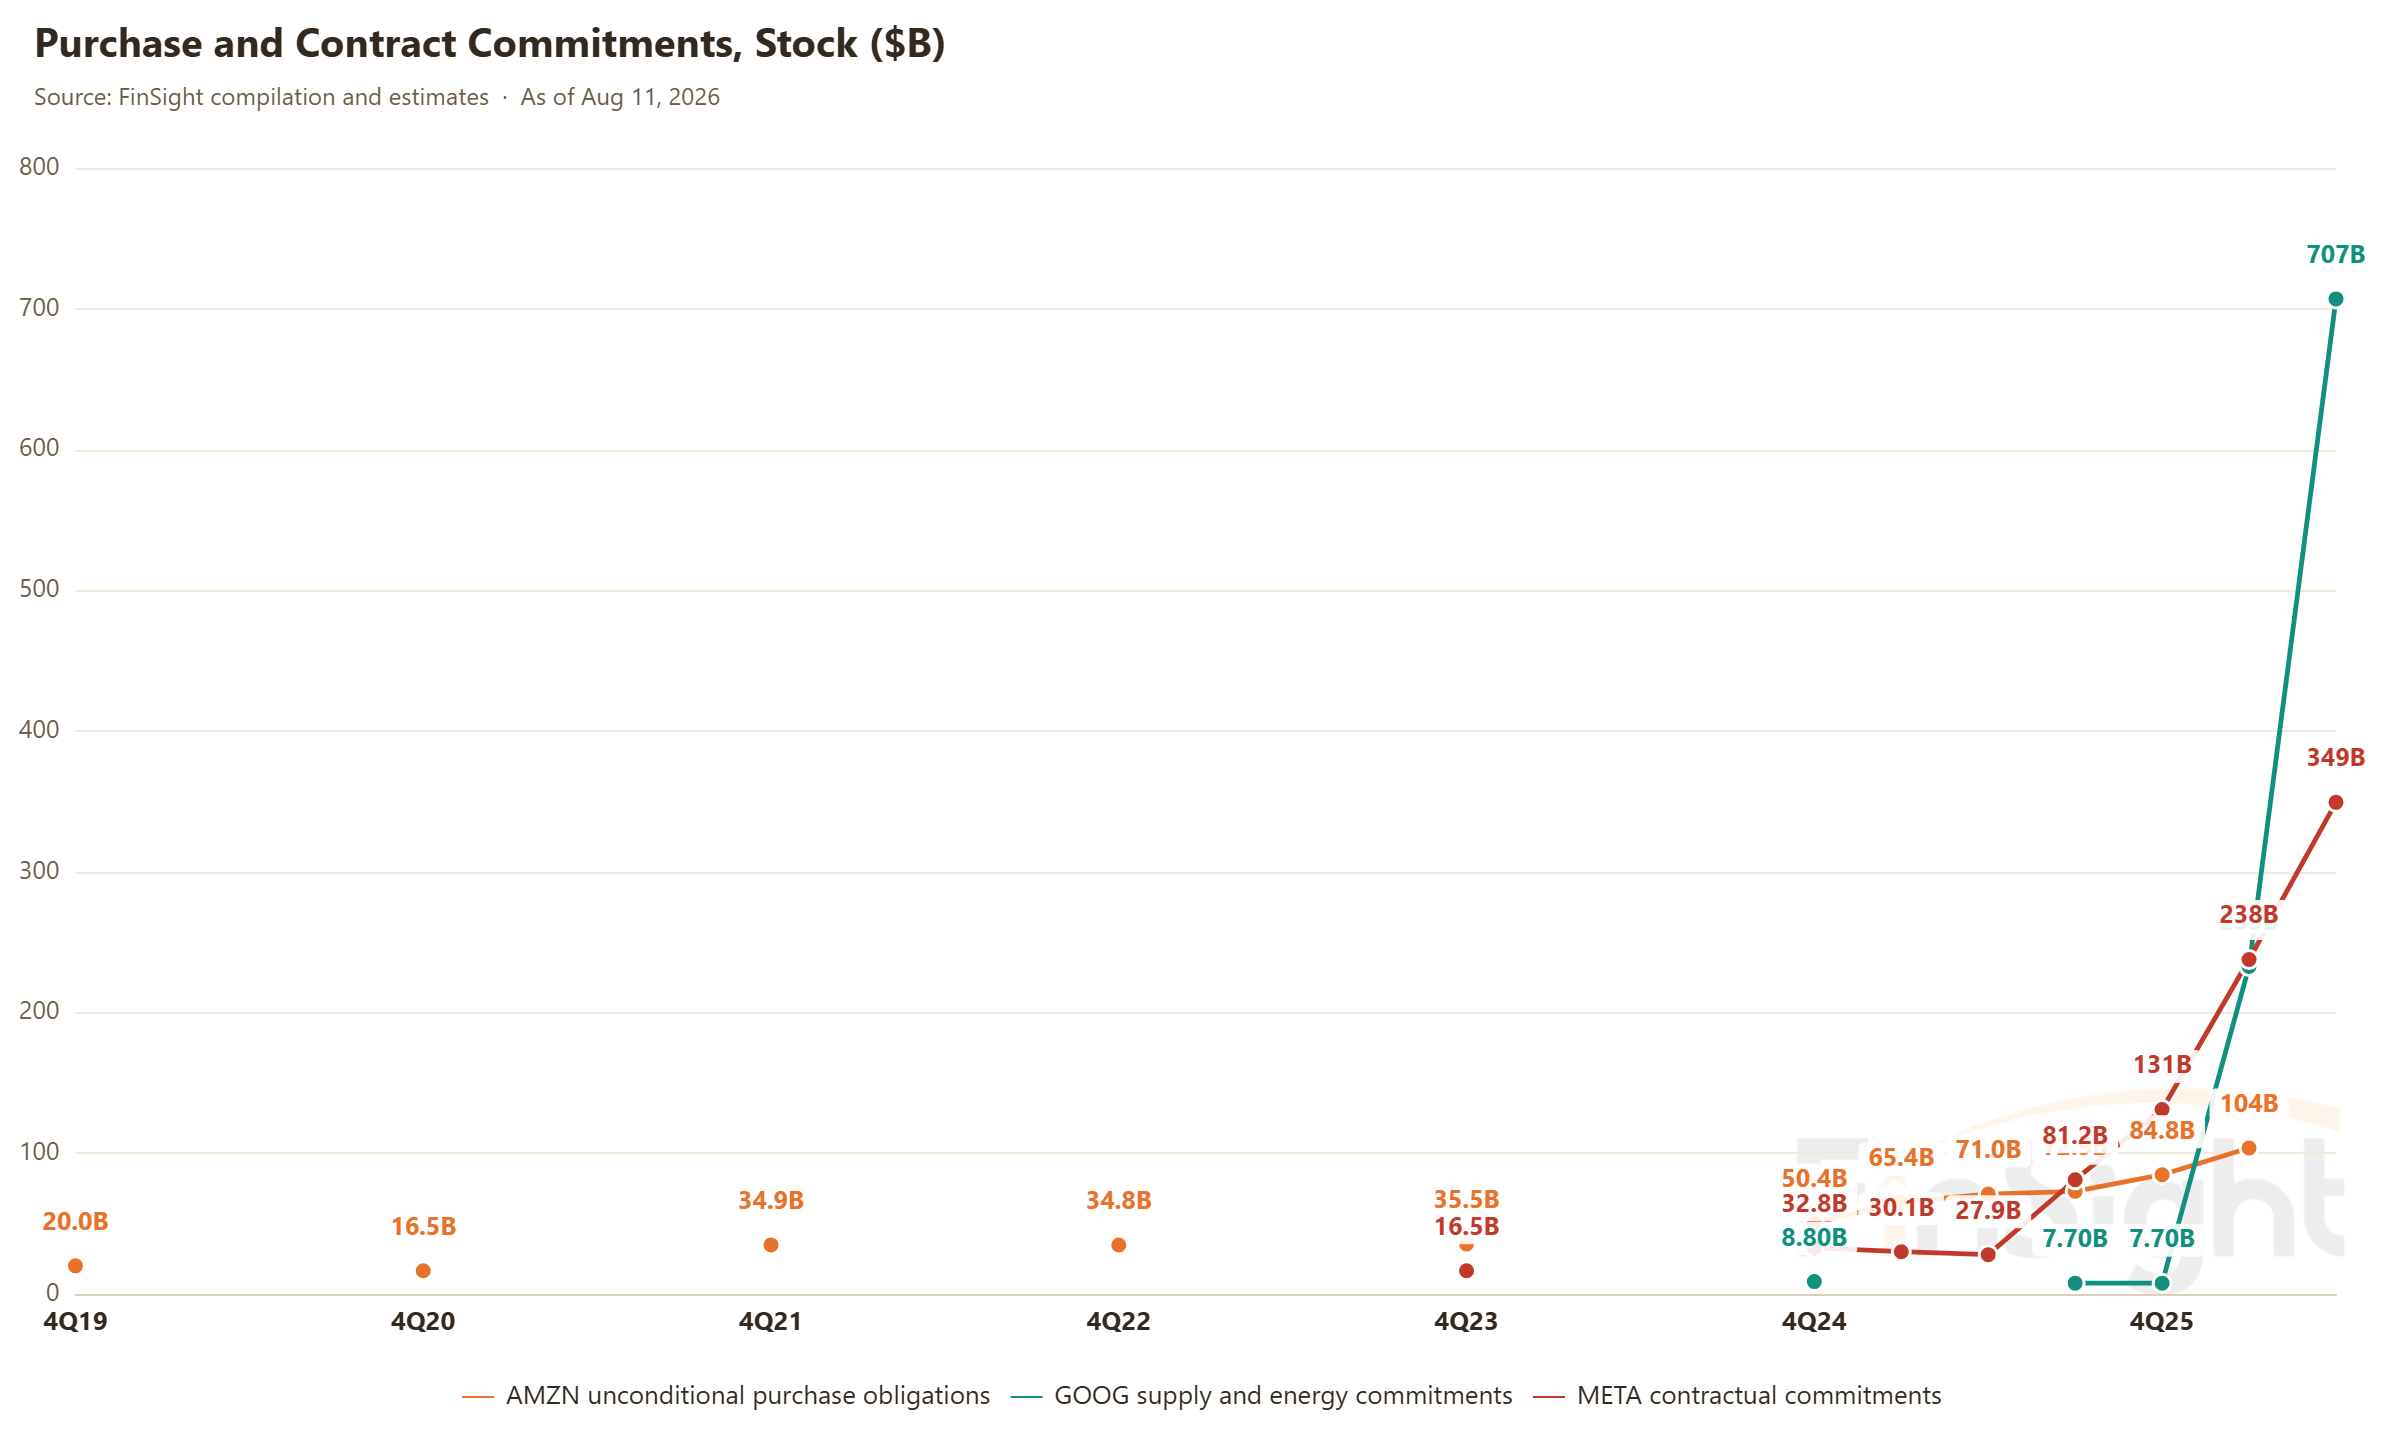
The commitment side is more forward-looking than any reported number. Across the four companies, leases signed but not yet commenced now total roughly $800B. Google's purchase commitments jumped from $232.7B to $707B in a single quarter, the first time the TPU and long-term power contracts show up in one place. Add all of that back to reported CapEx and you get all-in investment, and it says the money is still going up. Which leaves the harder question: is it money well spent?
Returns: compute keeps getting more valuable, payback finally has a number, and people are showing up with money
The loudest argument in the market is about when AI actually makes money. We drew the cost line in an earlier post. Each GPU has to earn about $4,500 a year to cover the full build and operating cost, which is the breakeven line. Above about $5,600 it covers the cost of capital too and adding capacity is worth doing, which we called the expansion sweet spot. At the time we could only get there by backing into it from model companies' end ARR. This quarter Andy Jassy gave the vendor's own answer out loud.
Amazon: AWS servers and networking gear break even in under three years on average. Servers now last at least five to six years, and most AI capacity is contracted for at least five years. That means two to three years past breakeven in which the gear throws off serious free cash flow. Jassy added that AWS profitability is not random, that it comes from disciplined efficiency gains, capacity optimization and fixed-cost management, and that the margin path of the AI business looks very much like the core cloud business at the same stage, only slightly faster.
Check that against our cost line. Payback in under three years means earning back more than a third of the build cost every year. At roughly $13k-19k of build cost per new-generation chip, that is about $4.3k-6.3k a year, which straddles the breakeven line and the expansion sweet spot exactly. Five-to-six-year useful lives with five-year-plus AI contracts also answer the charge that depreciation schedules are being stretched to flatter earnings: how long the gear actually runs matches how long it is written off. The profit is real. And in a sold-out market, rents actually being paid are $14k-18k, still more than twice the expansion sweet spot. Compute you can rent out is a high-margin business today.
| Yardstick | Range | What it says |
|---|---|---|
| Market-wide monetization intensity, 4Q25 to 2Q26 actual | $1.32k → $2.43k (+84%) | Still short of the breakeven line, but the slope is steep |
| The cost band from our July 22 post | $4.5k (breakeven line) to $5.6k (expansion sweet spot) | The two dashed lines everything else is measured against |
| AWS implied annual contribution per chip (payback under three years, 2Q26 call) | $4.3k to $6.3k | Lands right on the cost band; management's payback claim has a number behind it |
| What the sold-out market actually pays (two model companies, 2025 spend back-solved) | $14k to $18k | More than twice the sweet spot; compute you can rent out is a high-margin business today |
Same units as the July 22 cost curve: $k per H100e per year. Updated August 5, 2026.
Source: Amazon 2Q26 earnings call, FinSight estimates (see the July 22 post)
For payback to hold, one more thing has to be true. When costs rise, prices have to follow. Almost every company confirmed this quarter that costs get passed through.
- Google: renting compute from outside can be very expensive over a few months, but across the life of the contract the return is strongly positive, and to the extent input costs rise, that gets reflected in the price of the solution.
- Microsoft: much of the capacity is being sold under new contracts, where price can be set to hold the value.
- Amazon: when you sign a new contract, you take the cost into account and settle the price with the customer from there.
Can margins hold, though? The machines built in the frenzy of the last few years are now being written off year by year, and the real money is not the power bill, it is depreciation. D&A grew between 20% and 53% year over year, depending on the company, and that is the single biggest pressure on margin.
So we took each company's past capital spending, projected the depreciation that follows from it, put that on one chart against cloud revenue and let them race. Cloud revenue growth has moved back ahead of depreciation growth. Google is the clearest case: its public cloud is now growing faster than its own depreciation.
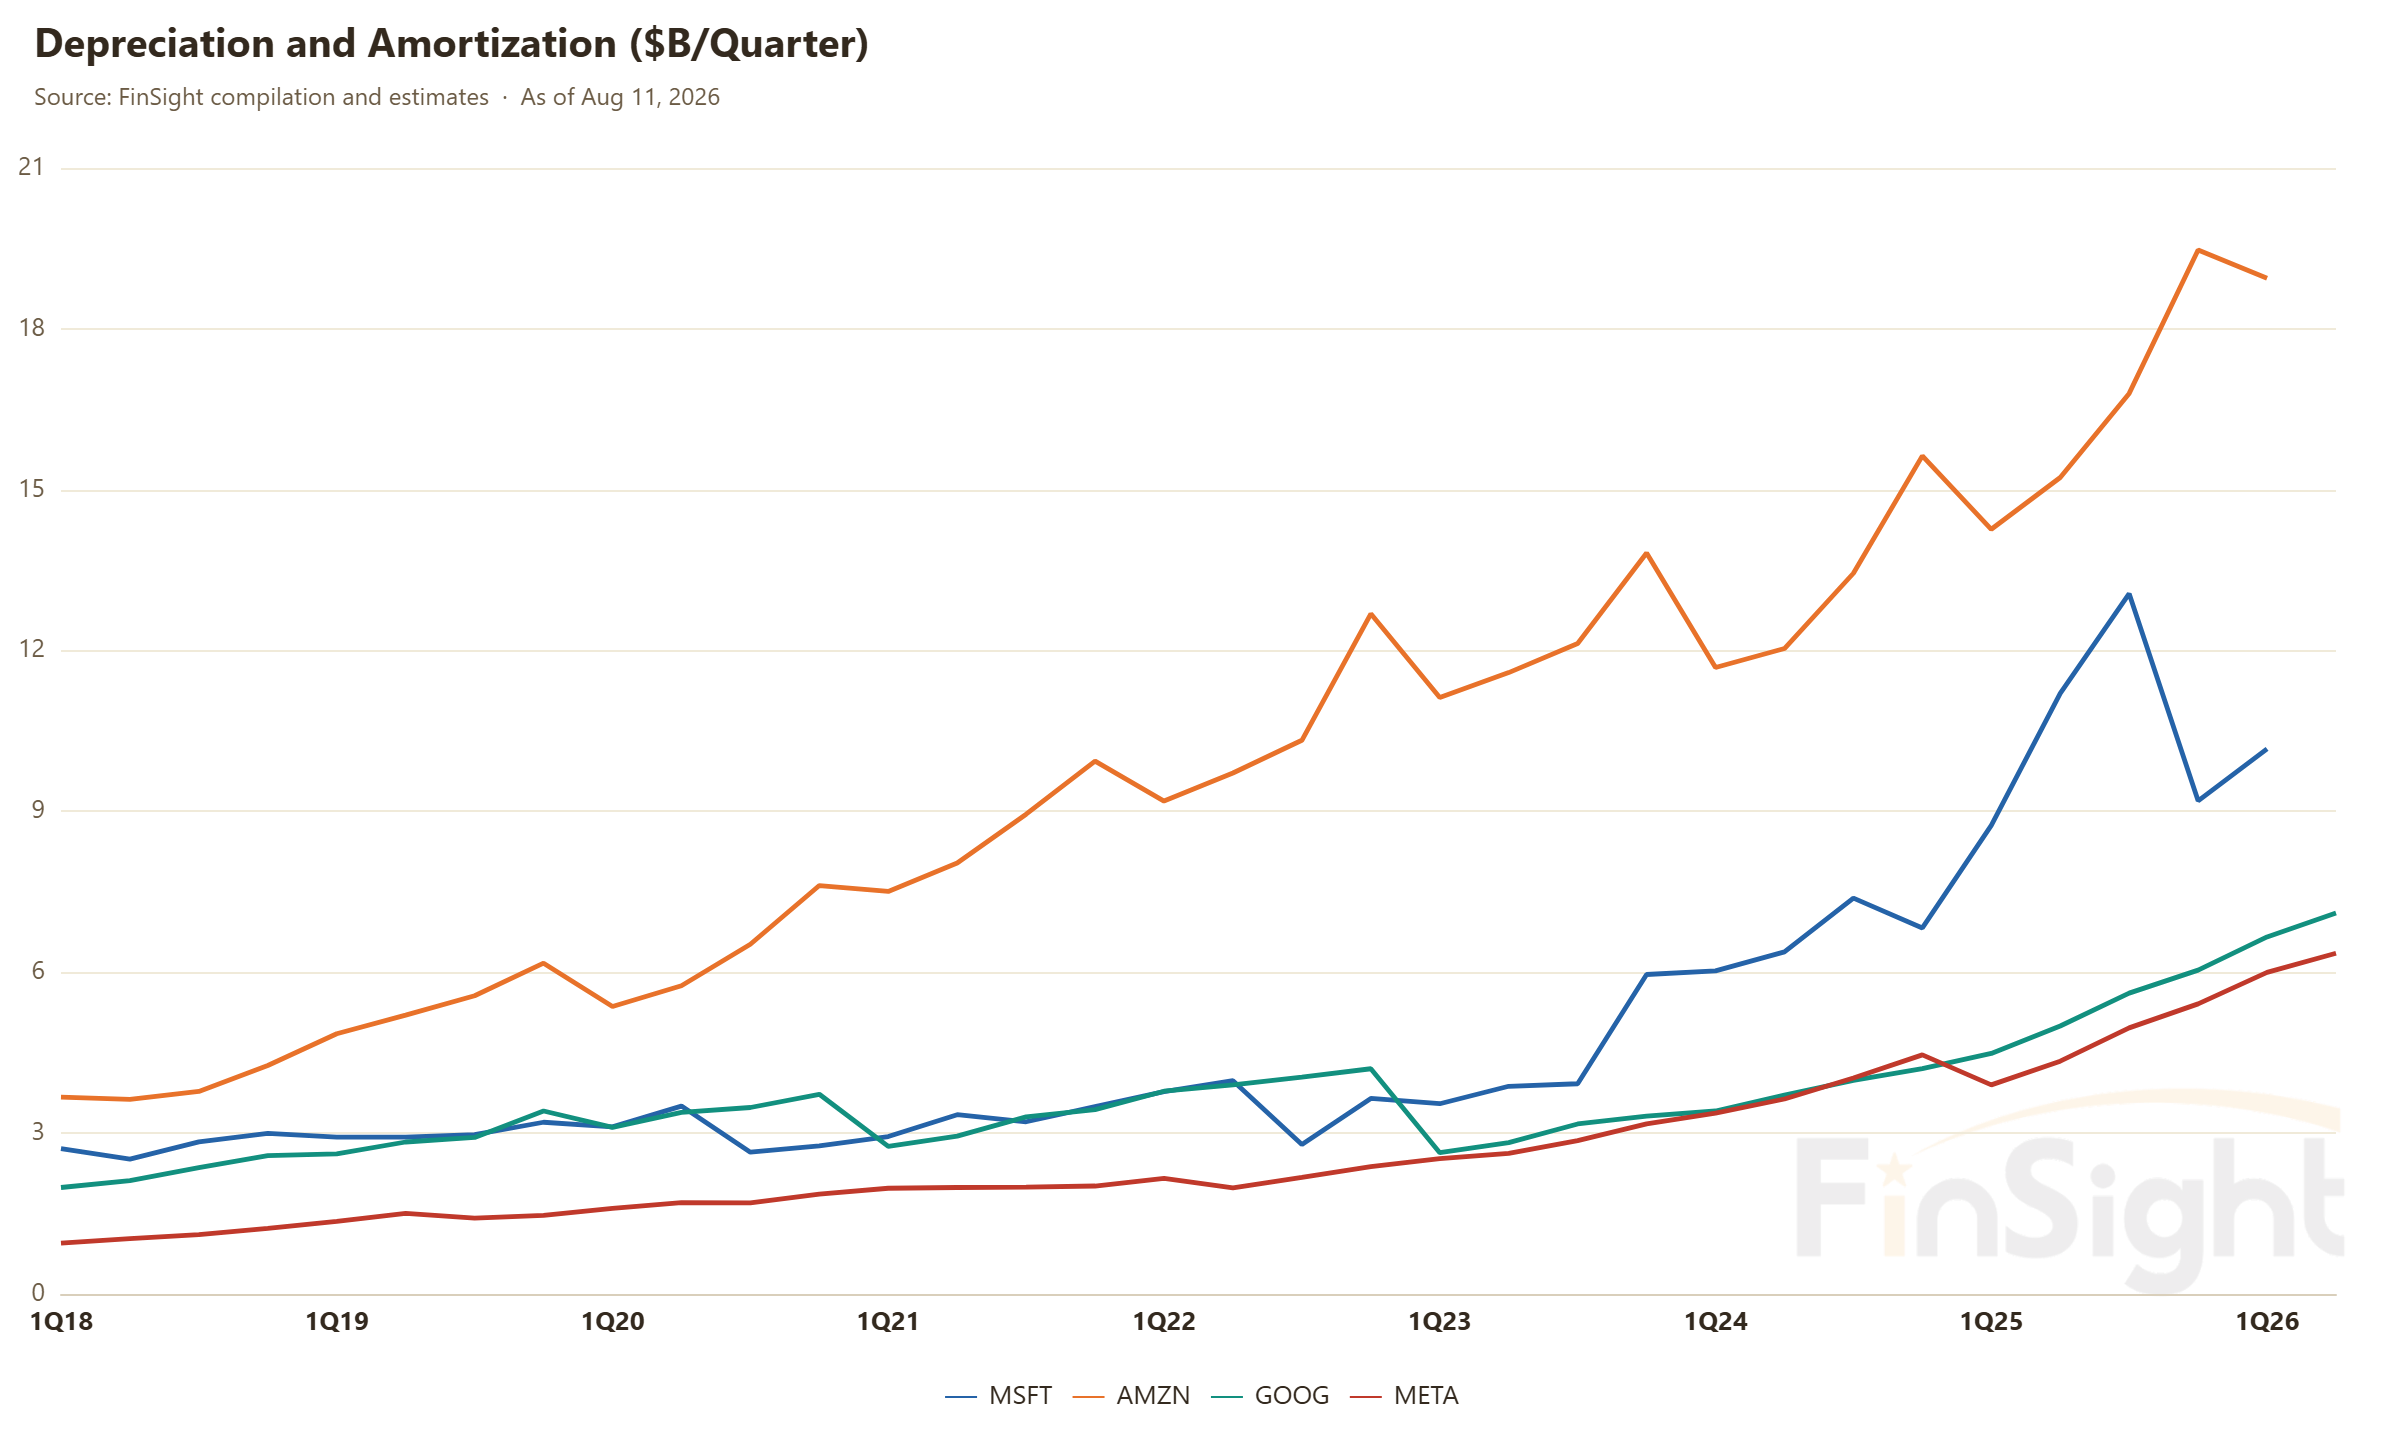
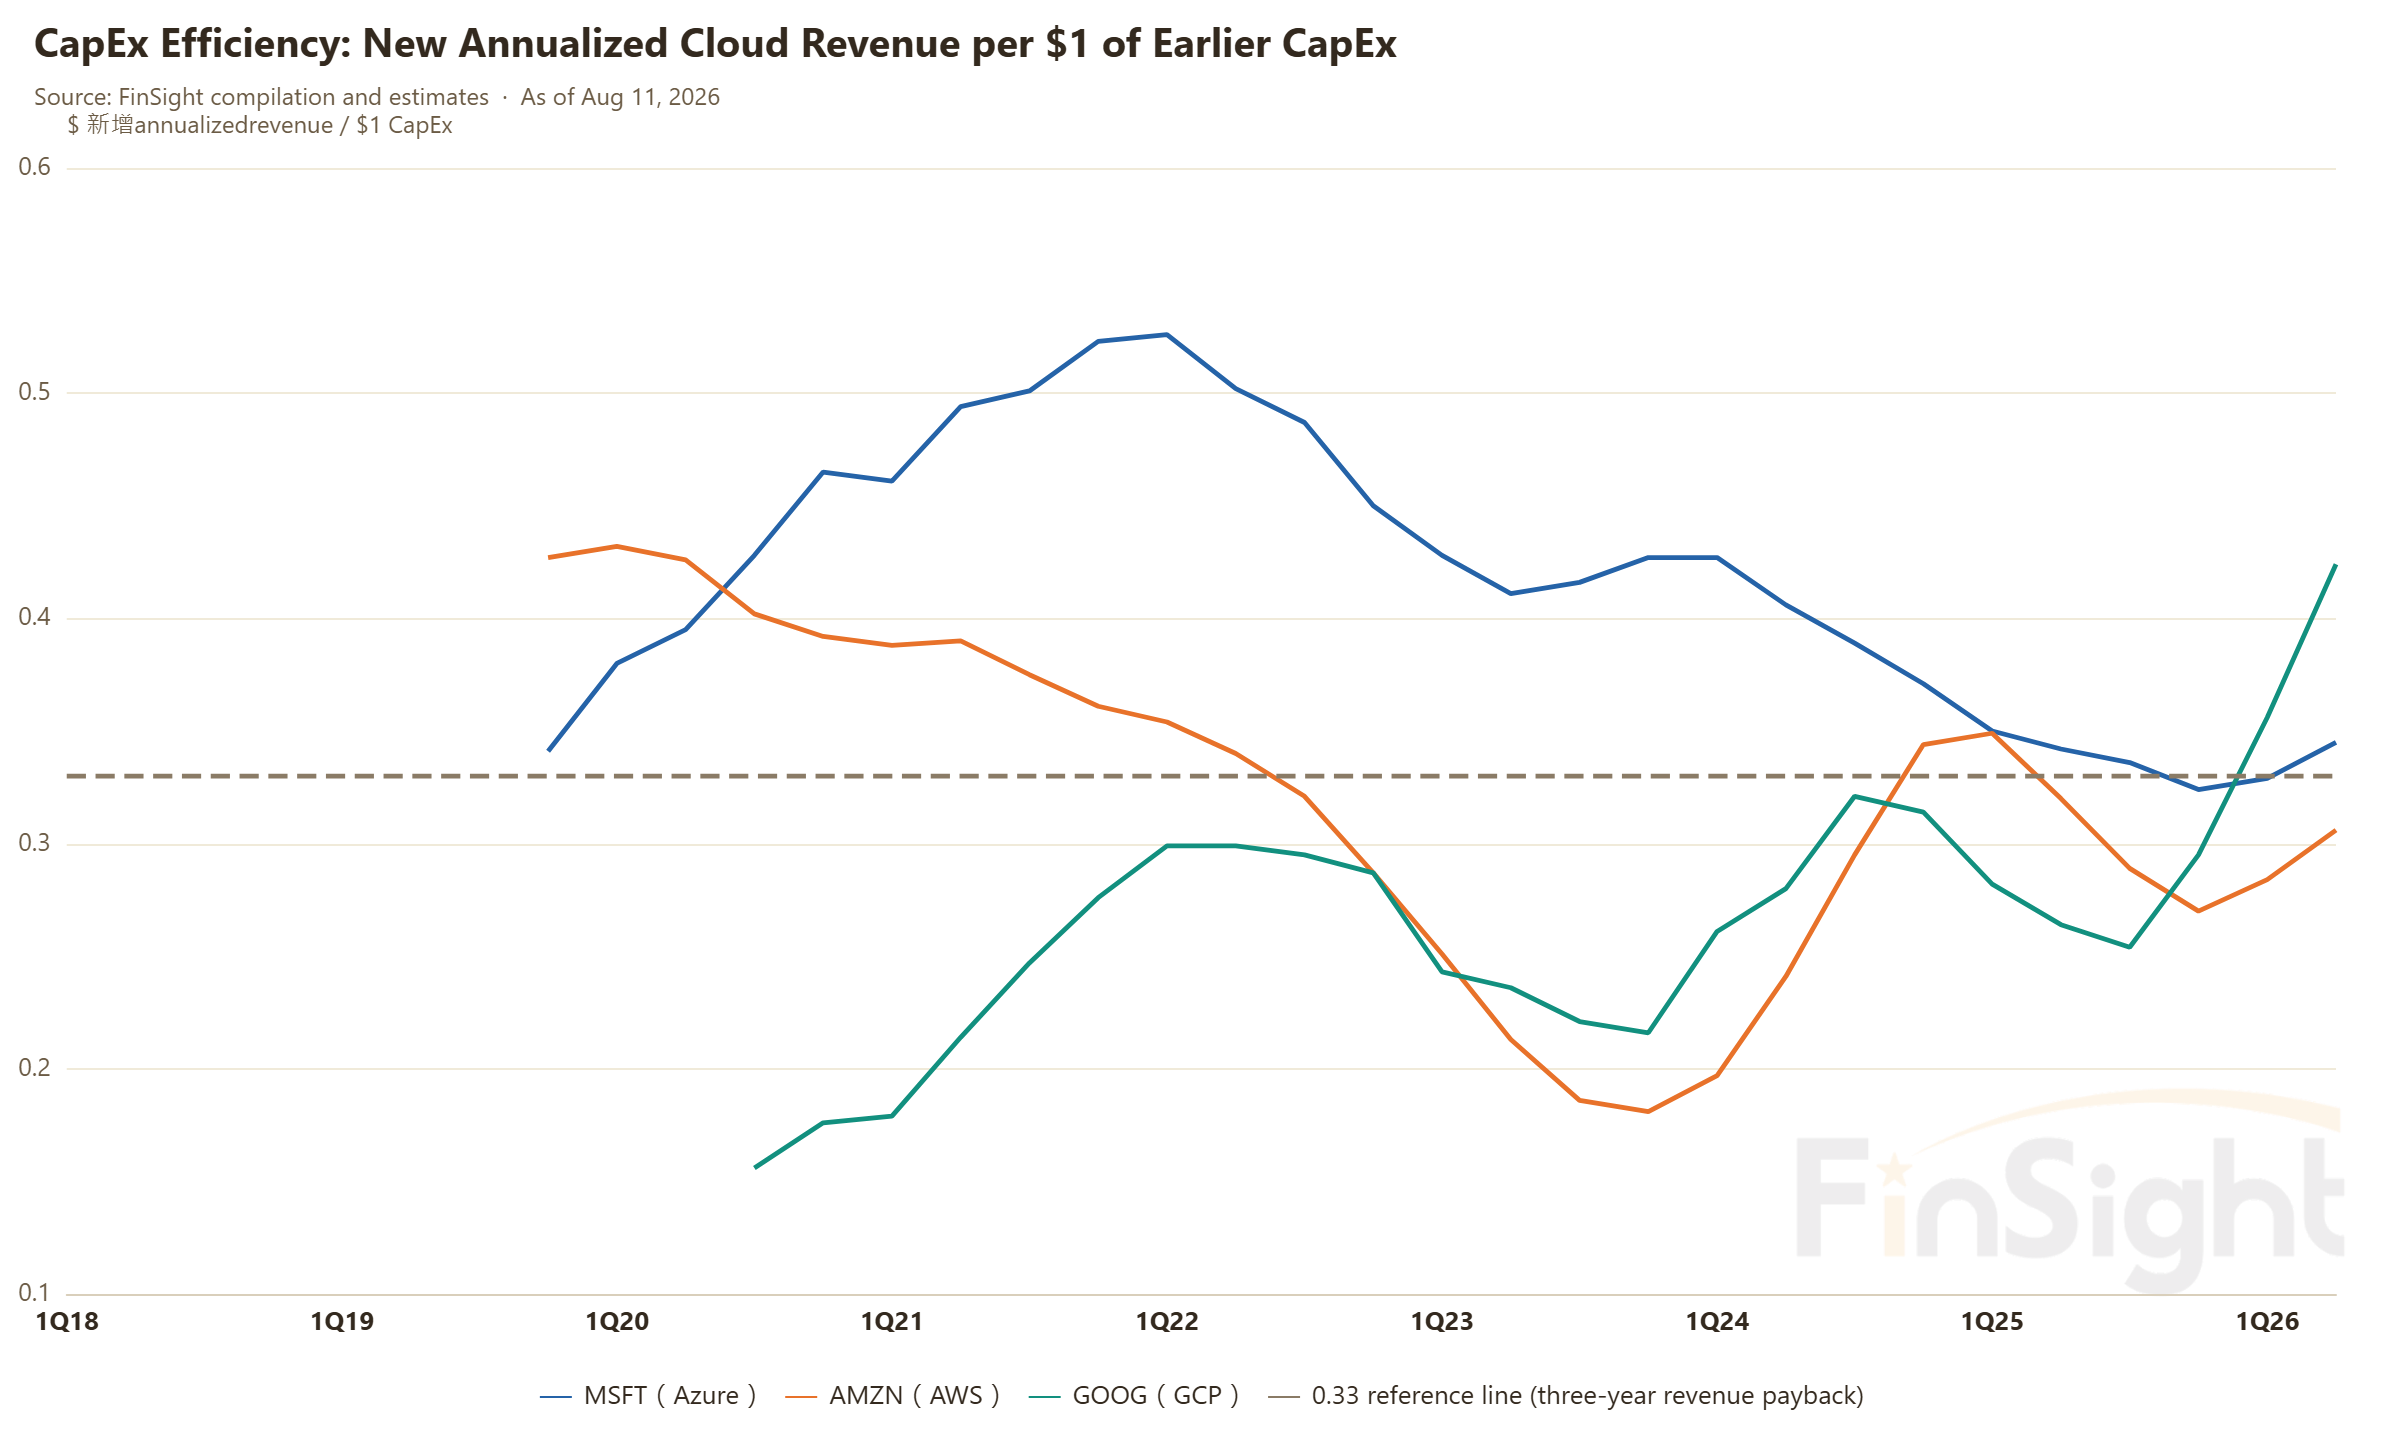
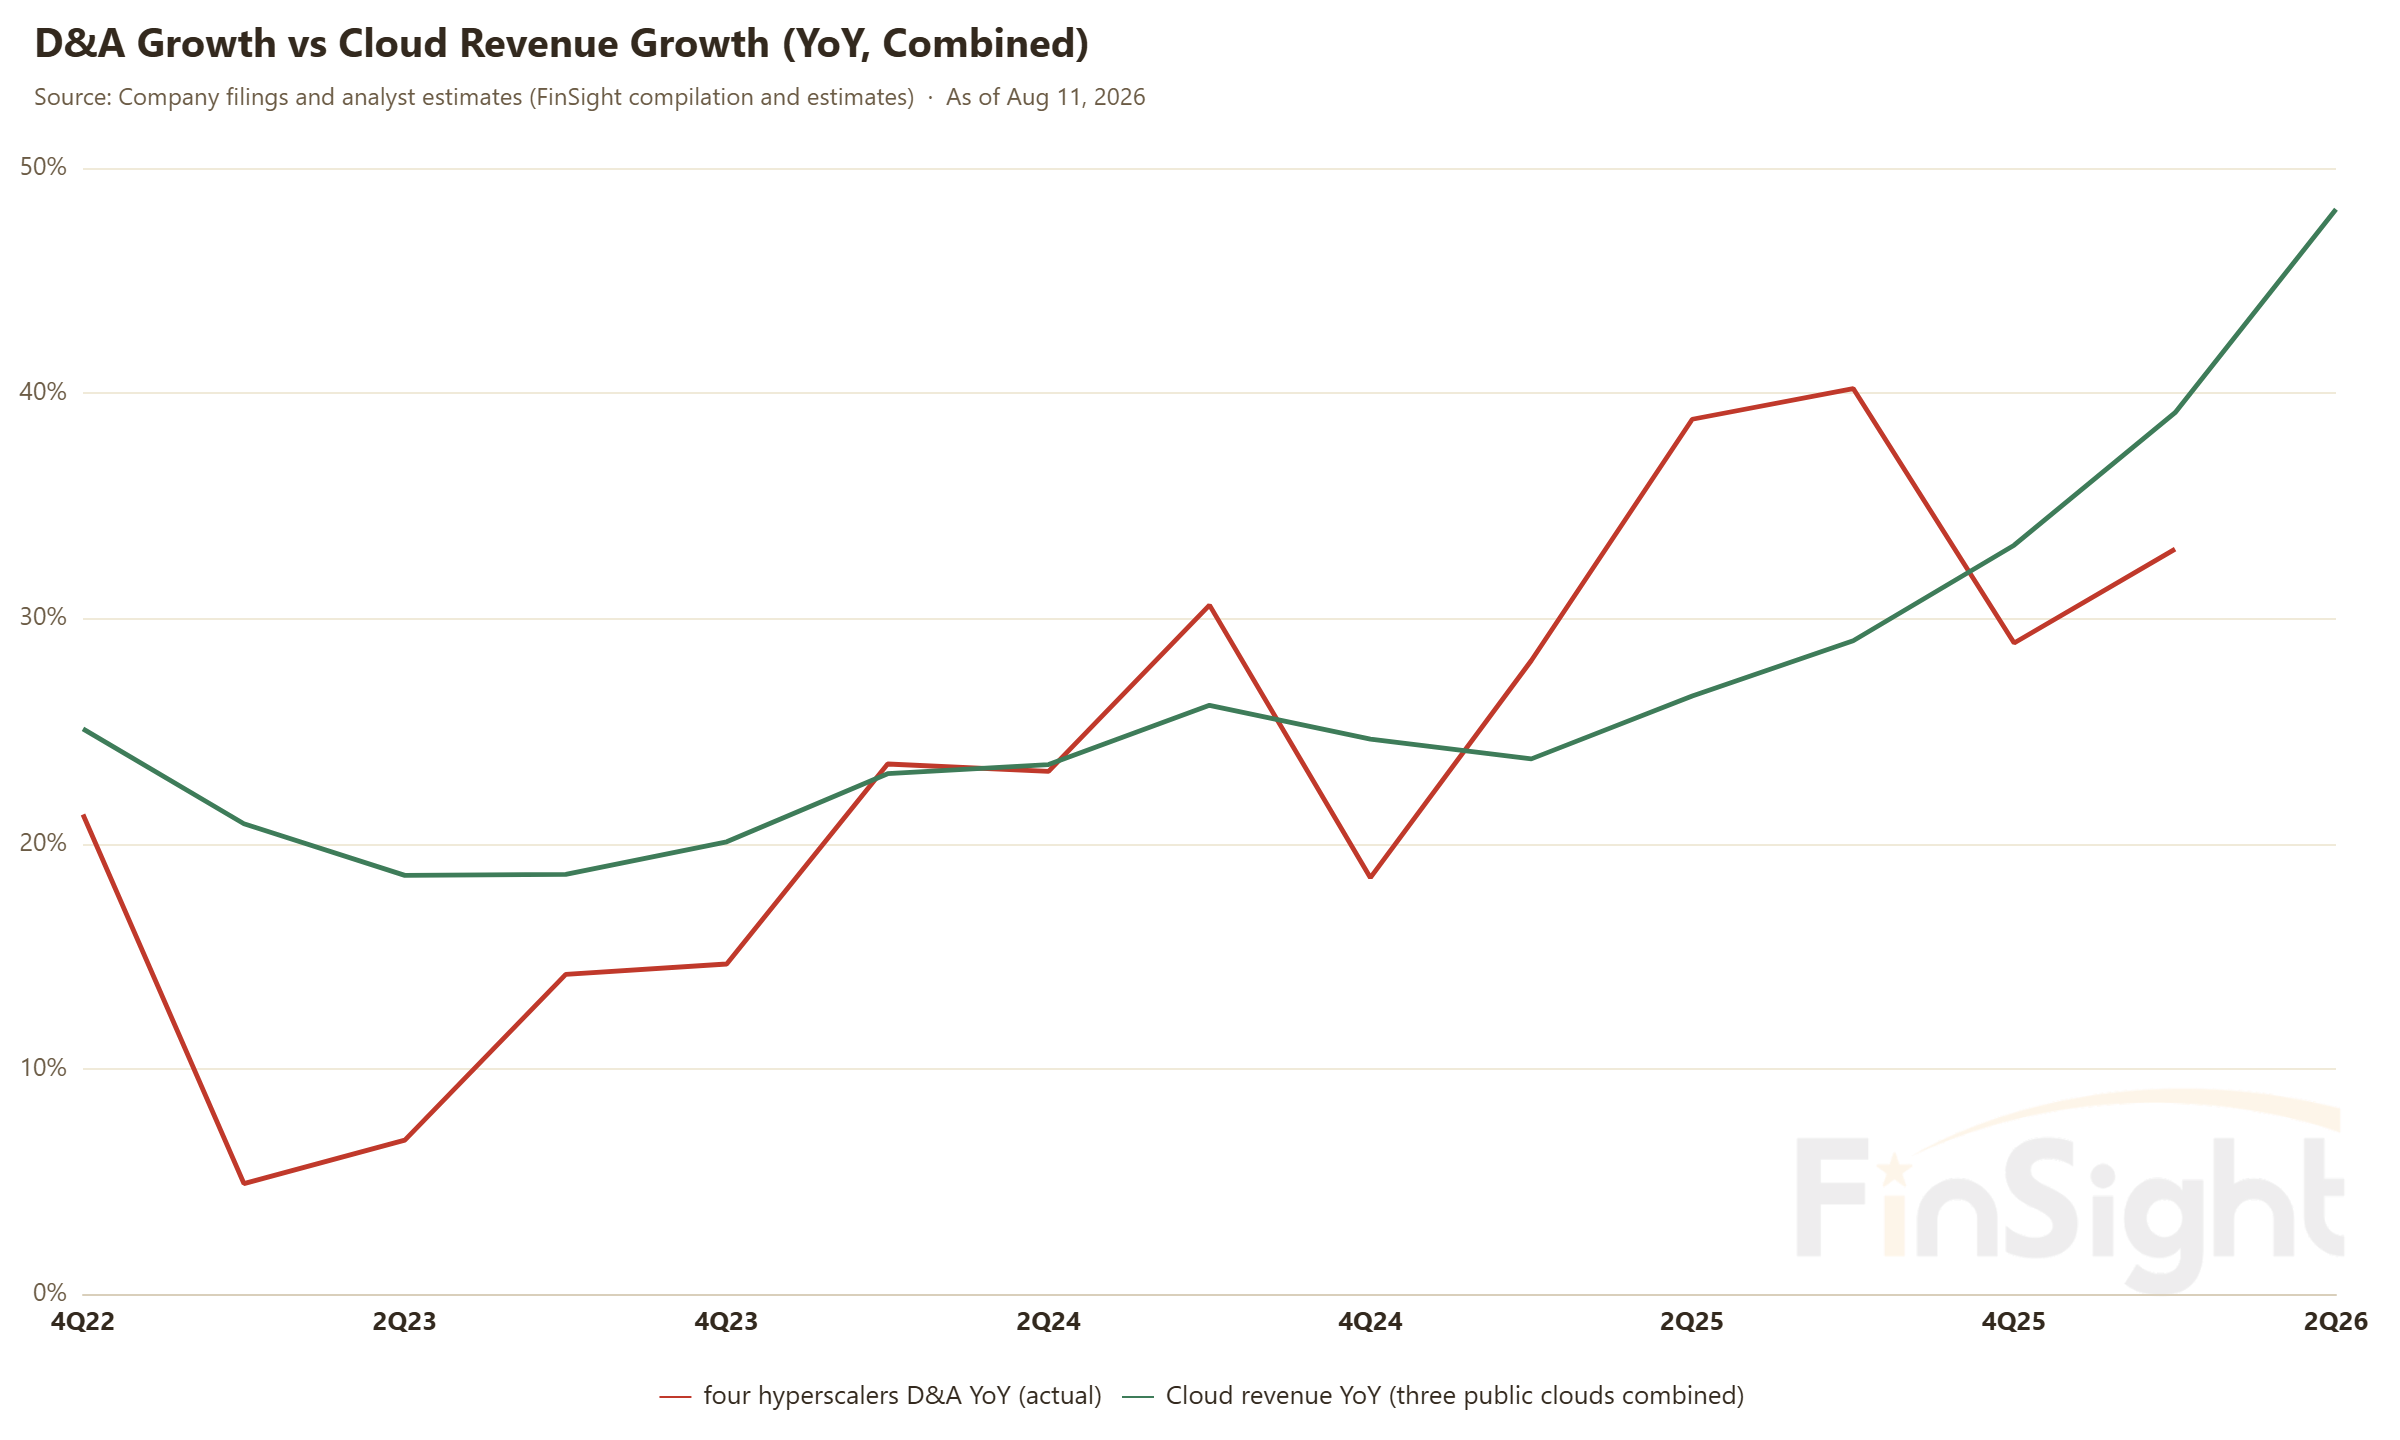
Depreciation is climbing. But revenue is climbing faster, investment efficiency has not slipped, and costs are being passed through. That is how margins go up rather than down under the heaviest capital spending on record. And this is the strict version of the comparison: four companies' depreciation against three companies' cloud revenue.
The most interesting part of the quarter comes last. Compute is starting to be bid for as an asset, and not just bid for. Deals are closing.
Start with the bids. On the call, Zuckerberg said Meta gets a lot of offers to buy its compute, at a meaningful premium to what it paid. Picture that: one of the most aggressive buyers of compute on earth has people showing up with money, offering more than its cost. He is not selling for now, because the margin on selling intelligence is much better than the margin on selling compute, but for the first time he put selling compute directly on the list of ways to monetize it. Susan Li added that given the excess demand for compute in the market, monetization could include selling compute outright. There is even a long-range idea: run something like an ad auction over Meta's own compute.
Now the deals that closed. Within a few weeks of the start of Q3, SpaceX sold six months of cloud capacity for $6.7B, about $13.4B annualized, recognized from October. The Colossus contract already contributed $1.6B in Q2, and the announced customers include Google and Anthropic. New compute deployments pay back in under a year. The CFO added a line of his own: the imbalance in the compute market is going to persist.
One company has buyers at a premium before it has offered anything; the other is closing at high prices. Both point at the same thing. There is far more money looking to buy compute than there is compute to buy. How strong is demand? Strong enough that the people holding the most compute are seriously thinking about selling it as a commodity.
Mark two earlier calls to market: that Meta and xAI are the underappreciated winners of a structure built on reserve compute, and that Anthropic has clearly under-reserved and will have to buy from outside. This quarter Meta put renting compute out on the table, SpaceX actually closed the sales, and Anthropic showed up on the customer list. Both calls have their first hard evidence.
One caveat on definitions. SpaceX says ARR could reach $100B by year-end. That is a December single-month annualization that mixes in Starlink, launch and the Cursor acquisition. It cannot be read as evidence of AI compute demand. We count only what is contracted and recognized.
Q2 2026 in one line: booked into 2028, spending up across the board, compute worth more every quarter
One sentence for the quarter: the earnings ran through our scorecard item by item and checked out. Demand is real, and for the first time it is visible out to 2028. The money did not pull back; on a real basis it went up everywhere. The question of when AI makes money finally has an answer, and it comes from the vendors themselves. And compute is wanted badly enough that people arrive with cash, and the deals close.
Here is the part worth sitting with. The year every one of them wants to keep flexible, 2028, is exactly the year our own work says a lot of capacity comes online and supply and demand are most likely to turn. Their risk instinct and our supply-demand model point at the same year. Nothing in this kind of projection is ever settled. Our method is to bring the actuals back every quarter and update the scorecard, and correct when we are off.
Three risks are still worth naming.
- How fast efficiency improves. Efficiency is invisible supply. Microsoft got a 4x throughput improvement on Copilot in six months and now routes 90% of tasks to small models, leaving 10% for frontier models. That cuts both ways. In a shortage it is a bullish signal: the same compute produces more revenue, and part of Microsoft's beat this quarter came from exactly that. For our supply-demand work it is a risk: if optimization keeps running ahead of the 40% a year our model assumes, the 2027 gap is shallower than projected. The capacity efficiency freed up this quarter was absorbed by demand within the quarter. That will not be true every quarter.
- Memory prices pushing the cost band up. Most of Amazon's $20B increase is price, not more compute. Nominal CapEx is not real compute. If prices keep rising, the whole cost band shifts up and the breakeven line goes up with it.
- The 2028 showdown. 2028 is the year all four are keeping flexible themselves. Servers are short-cycle assets: you order a few months before they go live, so if demand does not show up, the money never leaves. The brakes are real. That is what Nadella is getting at when he talks about reading up on 1873, the year the railroad building boom broke. Two scripts collide that year: demand hits the line early, or the build finishes into a glut. It is the single most important thing to watch as we update the scorecard each quarter.
One worry probably survives all of this. If demand is this strong, why is the market at the same time arguing about price wars on model APIs and worrying that vendors will cut each other down to nothing? We went back through three years of API pricing behavior at every US and Chinese model company. The thing people are worried about is real, but the structure is not what most people think. It is not across-the-board price cutting, it is tiering. And that tiering and the compute tightness in this post are two ends of the same line. The next post lays the data out.
Every chart in this post comes from our public hyperscaler capex dashboard.