
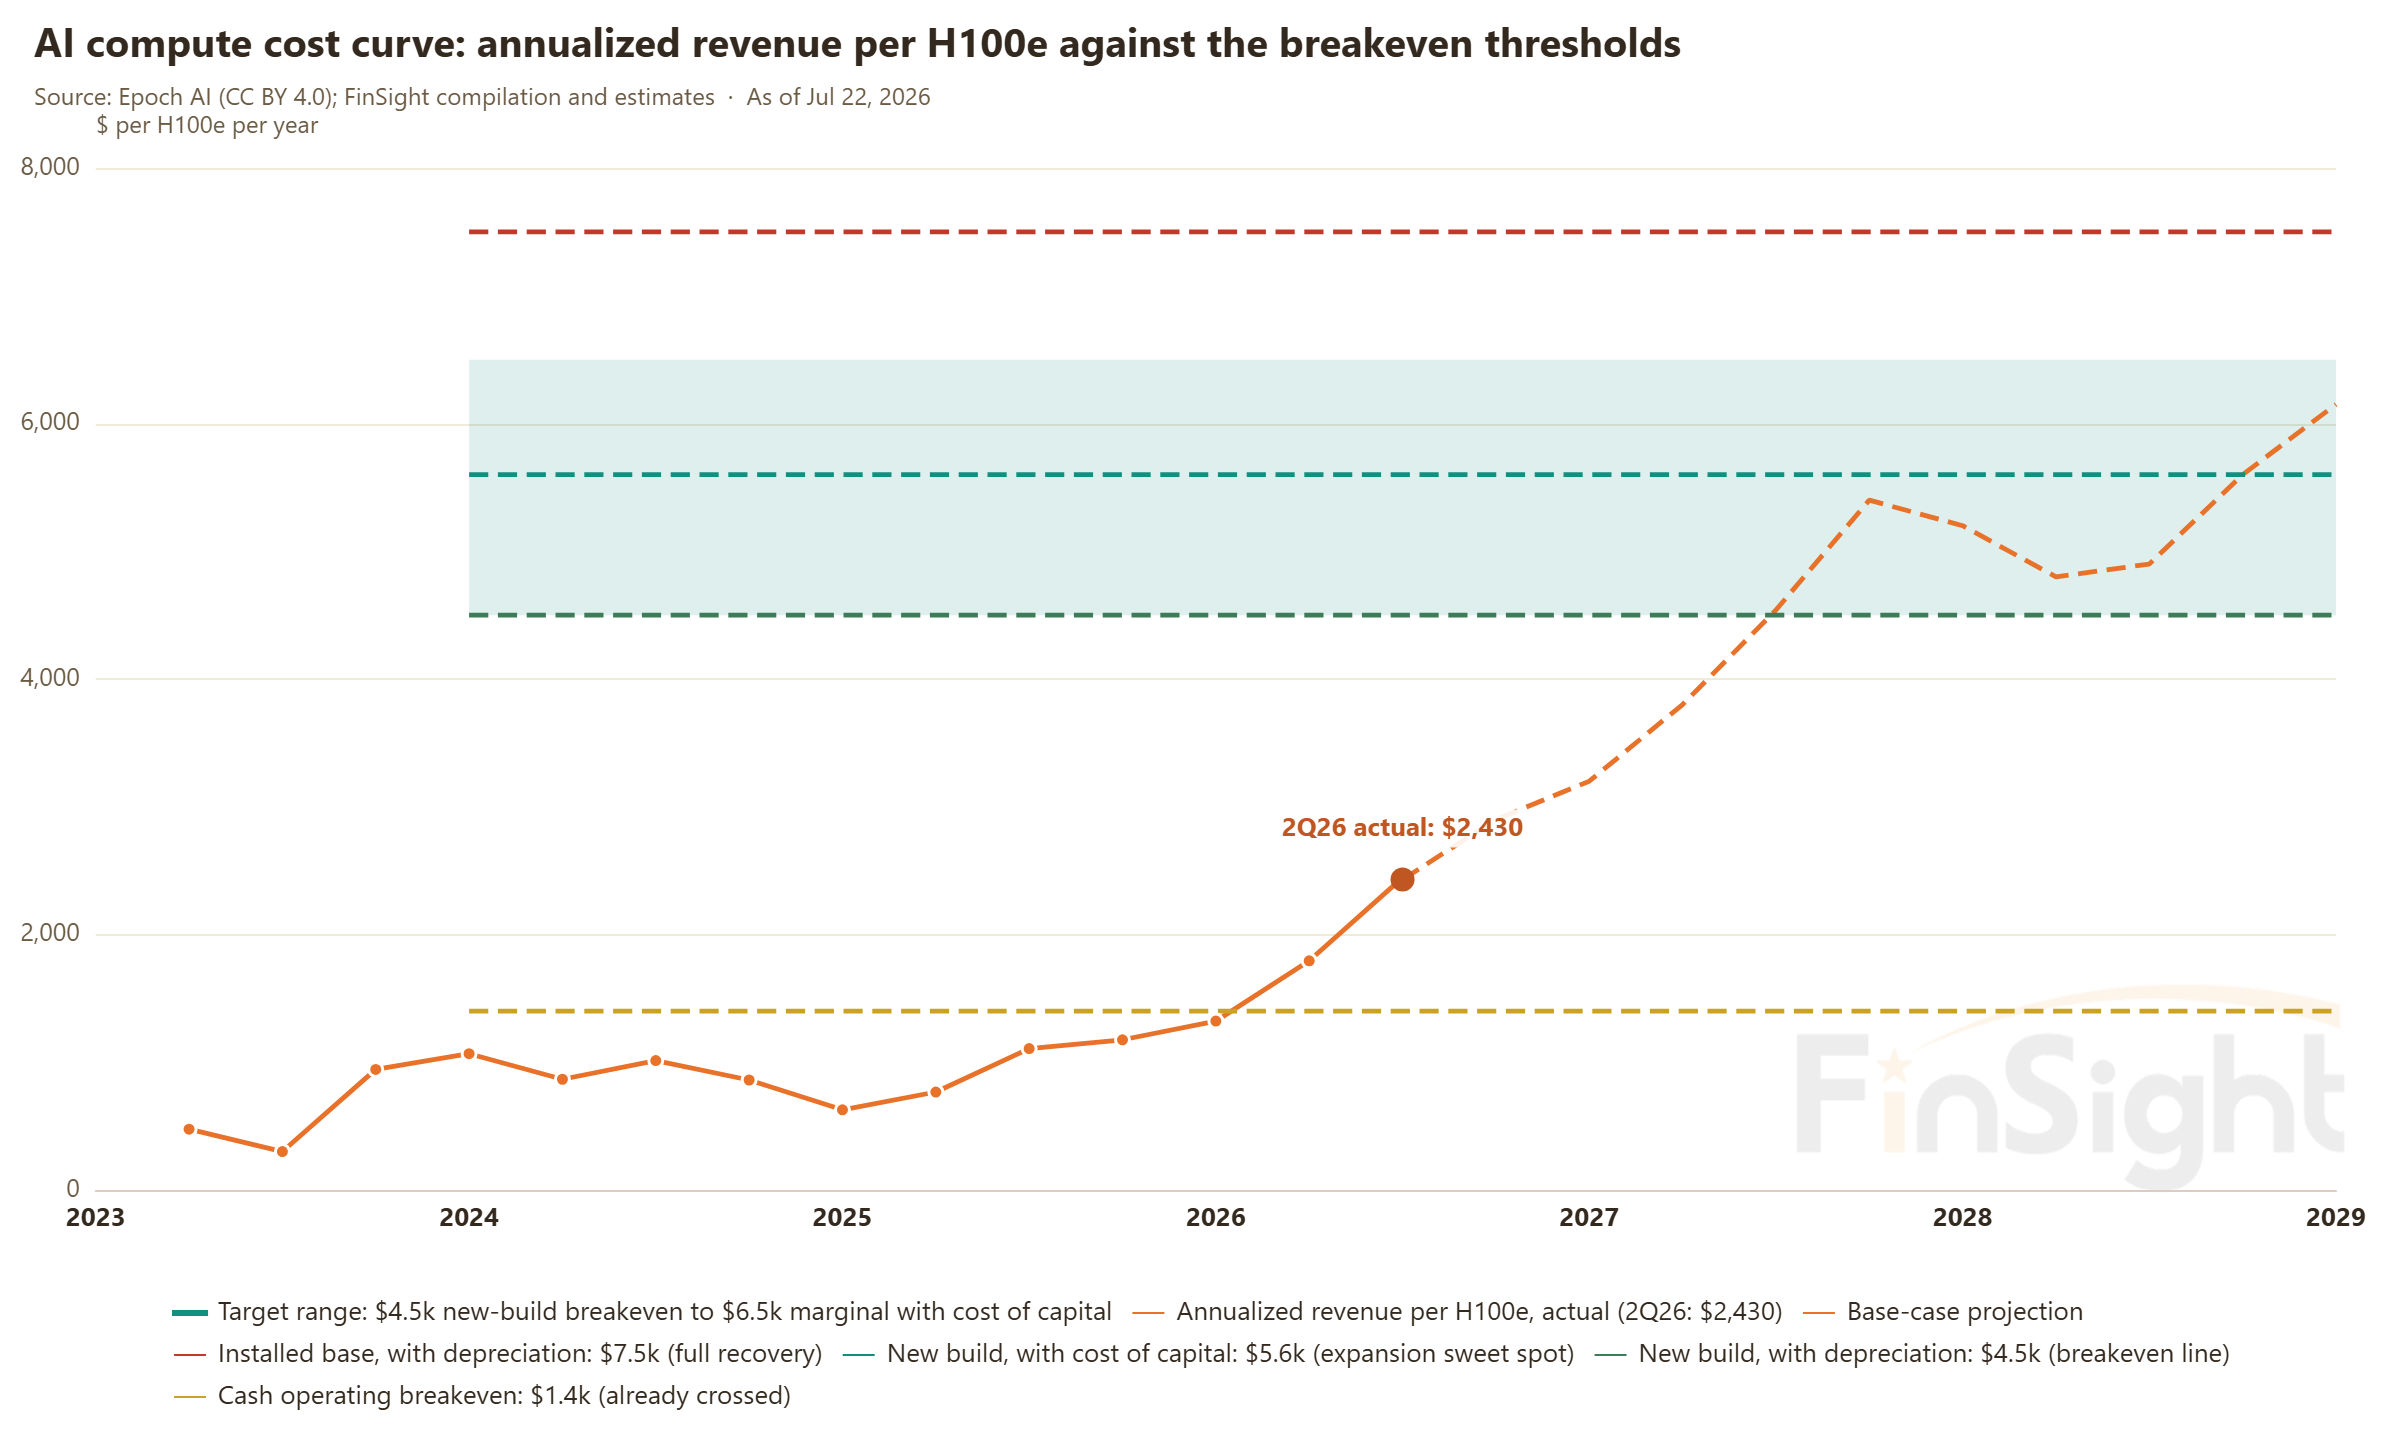
AI compute breaks even at $4.5k per GPU a year. Revenue per chip is $2,430 today, and on the current trajectory it hits the line in mid-2027.
Our last post set the demand curve against the supply schedule and came out with three conclusions:
- Revenue per GPU turned up at the end of 2025, which lines up with GPU rental prices rising in December and AWS and Google Cloud raising prices this January.
- 1H27 is the point where the least new data center capacity comes online, and the squeeze runs at least through the second half of 2027.
- Given who has locked up capacity, whoever is sitting on reserve compute is the underappreciated side of this. Meta starting to rent its own compute out is a strategy shift that falls straight out of that structure.
Key takeaways
- New-build breakeven runs $4.5k per chip a year; the expansion sweet spot, which also covers a 10% cost of capital, runs $5.6k.
- Monetization intensity is $2,430 today, about half of breakeven, but at this slope the base case touches $4.5k in mid-2027.
- The sold-out market already answered: OpenAI and Anthropic pay $14k-18k per chip a year, more than twice the sweet spot.
- Blended purchase price per H100e fell from $38k in 2022 to about $14k, so the crossing arrives earlier than a static estimate says.
And we closed by promising that the next post would work out the expansion sweet spot. This is it.
There is no shortage of arguments about AI CapEx right now: how many years a GPU should be depreciated over, where the ROIC is, whether the money ever comes back. Those are all the same argument in different clothes: when does AI actually start making money? Most of the debate stops at who is right and who is wrong. Almost nobody has drawn the cost line itself.
So this post does two things: work out what each GPU has to cover in cost over a year, then flip it around and back into how much AI ARR it takes to stand on top of that line.
Step one: put a number on the cost, one 1GW data center at a time
Take Epoch AI's published 1GW model (May 2026) at face value:
- A typical 1GW US AI data center costs $38B up front, and only $0.9B a year to run after that.
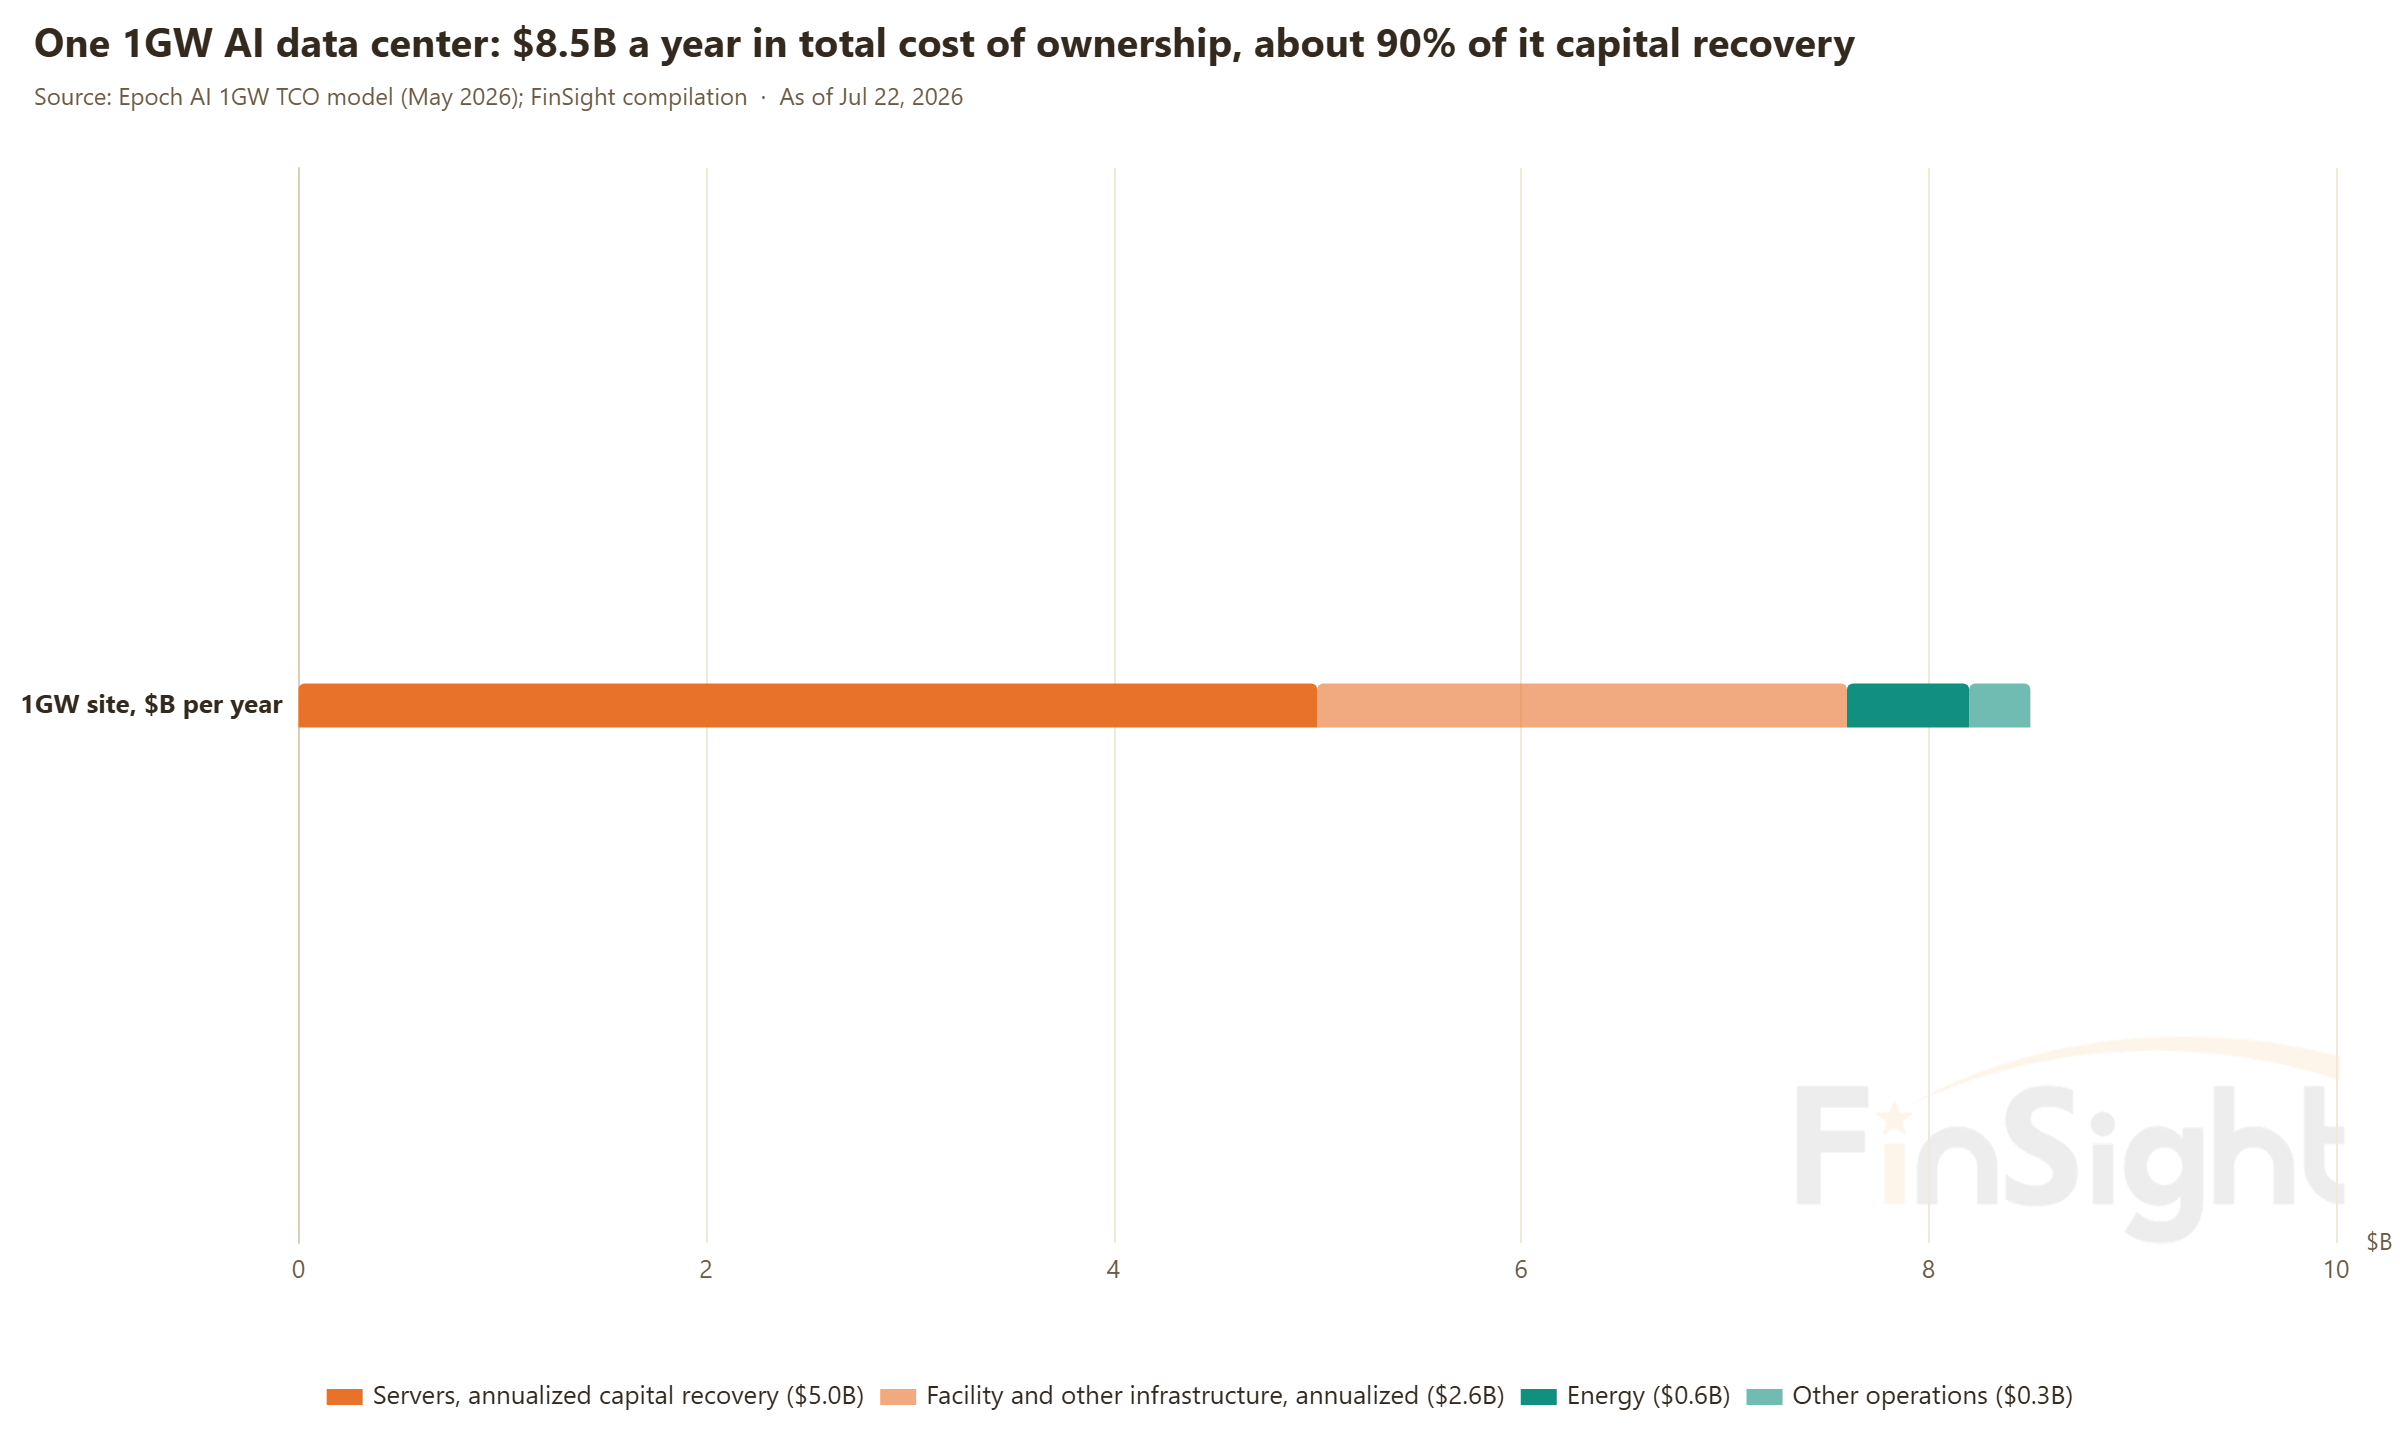
- Spread the up-front investment over its useful life and total annual cost of ownership is about $8.5B, 60% of it servers.
Note one counterintuitive piece. Power is the largest operating expense and it still comes to only $0.6B a year. The big money is depreciation, not electricity. It was spent before you switched the box on. The cost fight is entirely about how many years you spread the equipment over.
Now convert the cost to a per-GPU basis. First the unit: H100e converts every kind of chip on the market, custom ASICs included, into how many H100s it is worth. Using the median across 31 large sites, 1GW works out to about 1.24M chips. Median build cost across the installed base is $30.6k per chip, or $37.9/W, mostly H100 generation. New-generation sites (the Stargate series, B300, TPU v7) run only $13k to $19k per chip. Annualize the new-generation cost and you get a stack of thresholds.
| Threshold | How it is built | Key assumption | Range |
|---|---|---|---|
| Cash operating breakeven, $1.4k | $0.9B per GW ÷ 1.24M chips | Power and maintenance only, no capital recovery | $0.7k; we use a conservative $1.4k. Already crossed |
| New build, with depreciation, $4.5k (the breakeven line) | New-generation capex of $13k to $19k per chip ÷ 5 years, plus opex | 5-year straight-line depreciation; new-generation chip mix | $4.0k to $5.2k, midpoint $4.5k |
| New build, with cost of capital, $5.6k ★ (the expansion sweet spot) | ($13k to $19k) × 26.4% capital recovery factor, plus opex | 5-year life, 10% WACC annuity. Above this line a new build has positive NPV at a 10% cost of capital, and adding capex stops being an act of faith | $4.8k to $6.4k, midpoint $5.6k |
| Marginal, with cost of capital, $6.5k | Epoch's annualized 1GW total cost of ownership: $8.5B a year ÷ 1.24M chips | Derived independently of the capital-recovery method; the two converge | $6.2k to $6.9k; $6.5k is the top of the target range |
| Installed base, with depreciation, $7.5k | Median installed-base capex of $30.6k per chip ÷ 5 years, plus opex | The installed base includes the pricier H100 generation | $7.5k (with 3-year depreciation: $11.6k) |
| Installed base, with WACC, $9.5k | $30.6k × 26.4% capital recovery factor, plus opex | Full economic breakeven: the entire installed base earns its money back | about $9.5k |
Model assumptions: 5-year equipment life, 14-year building life, PUE of 1.14, 71% utilization, power at 8.34 cents per kWh. 1GW is about 1.24M H100e; median installed-base build cost is $30.6k per chip ($37.9 per watt); new-generation sites run $13k to $19k per chip.
Source: Epoch AI (CC BY 4.0); FinSight compilation and estimates
The two that matter:
- New-build breakeven line, $4.5k per chip per year. A newly built data center has to earn this on every GPU just to cover the machines.
- Expansion sweet spot, $5.6k per chip per year. That covers the machines, pays a 10% cost of capital, and still leaves something over. Above this line, building another data center is a good business and operators race to add capacity.
We tested this set of thresholds two independent ways. One: the $37.9/W we built up by working through 31 sites one at a time, against the $38B/GW in Epoch's model, which assumes GB200 servers. Different inputs, same answer. Two: Epoch's own annualized total cost converts to roughly $6.2k to $6.9k per chip, which sits between the sweet spot and full recovery on the installed base, exactly where it belongs.
Which assumption moves the thresholds most? How many years you spread the equipment over. Three years versus seven swings every threshold by 45% either way. Power price, PUE and utilization together are worth 15%. And on that one, reality sits on the longer side. The cloud majors have already pushed accounting depreciation out to five and six years, and A100s that shipped in 2020 are still out on rent today, at rents making new highs for the move (see the last chart). A GPU past its depreciation life still throws off cash. So taking five years is the market's mainstream assumption, not an optimistic one.
One more thing the market's arguments usually miss: the cost line is falling on its own. The market-wide blended purchase price per H100e has come down from $38k in 2022 to around $14k, roughly 60% in four years. That is what happened, not a forecast. It shows up in build cost as new-generation sites costing about 40% less per chip than the H100 generation. Software is helping too, with more tokens squeezed out of the same silicon every year. Revenue per chip going up while the cost line comes down is a scissors move. The crossing arrives earlier than a static estimate says, not later.
Cost per watt is roughly flat ($37.9/W, about $38B per GW), but new-generation sites pack more H100e per watt, so cost per chip falls about 40%. The path inside the band is illustrative.
Step two: where are we now? At this slope, the breakeven line in mid-2027
The cost line is drawn. The next question is how far the whole market is from making money.
The yardstick is the same one we used last post, annualized revenue per H100e, or monetization intensity: the observable ARR of five model companies (OpenAI, Anthropic, xAI, Mistral, Zhipu) divided by the market's cumulative H100e compute. That is annual AI revenue per GPU in the market. The 2Q26 reading is $2,430 per chip per year, which is $72.9B divided by 30M chips. That is still well below the $4.5k breakeven line.
To be clear about what this measures: it is not a cloud operator's measured ROIC. It asks a more basic question: can end AI revenue support this much compute at all? The model companies' ARR is where cloud rent ultimately gets paid from, so whether the rent is affordable comes back to this line. And this yardstick's upturn at the end of 2025 was confirmed by the rental repricing and the public cloud price increases, which is why we are willing to run it forward.
There is distance left to the breakeven line, but look at the slope. This number was $1,318 two quarters ago, up 84% in six months. Feed in the supply schedule and the base-case ARR path from our last post, and revenue per chip touches the $4.5k new-build breakeven line in mid-2027 and clears the $5.6k expansion sweet spot in 2H28.
Step two, continued: the sold-out market already answered, with OpenAI and Anthropic paying $14k-18k, more than twice the sweet spot
Everything above is a market-wide average, which blends the chips earning well with the ones still sitting idle. The sold-out market is running a lot hotter than that. Epoch tallied what the two leaders, OpenAI and Anthropic, actually paid last year, and we back into implied annual spend per chip from there:
- Numerator: the two of them paid clouds $24.1B for compute in 2025, made up of $16.3B and $7.8B, training and inference together.
- Denominator: the compute they were actually using that year. Epoch can attribute about 0.87M chips on average. Because that coverage is incomplete, we scale the denominator up 1.5x to 2x, to 1.3M to 1.7M chips. Without scaling it at all the answer is $27.7k, so this is already the conservative band.
- Divide and you get $14k to $18k per chip per year, already more than twice the $5.6k sweet spot.
The revenue side gets to the same number. SemiAnalysis's financial reconstruction of Anthropic (July 8, 2026) estimates annualized revenue of $60M per MW later this year at a gross margin of about 65%, which means 35% of revenue is what goes back out as compute cost. That works out to about $17k per chip per year ($60M times 35%, divided by 1,239 chips per MW), right in the middle of the $14k to $18k band. One path starts from what was actually paid, the other from revenue less gross margin. Two independent routes, same number.
| Path | How it is built | Result |
|---|---|---|
| Paid spend, two leaders | $24.1B paid to clouds in 2025 ÷ 1.3M to 1.7M chips (Epoch's 0.87M attributed chips scaled 1.5x to 2x) | $14k to $18k |
| Revenue back-solve | $60M per MW × 35% compute cost share ÷ 1,239 chips per MW | about $17k |
| Rental market, annualized | H100 rental index (SDH100RT) × 8,760 hours | $16.6k at the low; $23.8k on Jul 20, 2026 |
| For comparison: the thresholds | Cash operating breakeven / new-build breakeven / expansion sweet spot / installed base with depreciation | $1.4k / $4.5k / $5.6k / $7.5k |
Source: Epoch AI (CC BY 4.0), market research, Silicon Data; FinSight compilation and estimates, July 2026
A few things to keep in mind about that $14k to $18k. It skews high, since the numerator may mix in storage, networking and other charges. The scaling factor on the denominator is our judgment call, set conservatively. And it is an average price, so the marginal price for grabbing new capacity is only higher. But the point holds: cut the number in half and it is still above the $5.6k sweet spot.
In a sold-out market, compute you can rent out is a high-margin business today.
Step three: what level of AI ARR is good enough? Backing into what it takes to touch each line
Back to the argument the market fights hardest about. Everything so far has been about how much each GPU has to earn in a year. Now flip it. Multiply each threshold by the compute installed at that date and it becomes how much AI ARR the whole market has to do to reach the cost line.
Besides the breakeven line and the sweet spot, the table carries a third line along the bottom: $2,430 times the compute installed at that date, which is the ARR needed to hold today's tightness. Why does that floor keep rising? Because supply keeps coming online every quarter. If ARR merely holds still, the market gets looser. So failing even that bottom line means supply and demand are looser than today and the price-hike environment is over.
Using the table is simple. Pull the model companies' ARR any quarter, check it against the table, and you know which tier the market is in. No model to re-run.
The real value of the table is that it gives the market a standard it has been missing for a long time. Everyone talks about AI growth every day, and nobody has a hurdle rate for it, no standard for how fast growth has to be to count as fast enough. The most common line is that AI growth is slowing. But once the base gets big, a slowing growth rate happens by arithmetic. The question worth asking is whether the absolute dollars after the slowdown keep up with the cost line. This table is that anchor. Above the line, a slowdown is just arithmetic. Below it, demand is actually weakening.
| Compute at that date (M H100e) | Hold today's tightness ($2.45k) | New build, with depreciation: breakeven ($4.5k) | New build, with cost of capital: expansion sweet spot ($5.6k) | Marginal, with cost of capital ($6.5k) | Installed base, with depreciation ($7.5k) | Installed base, with WACC ($9.5k) | |
|---|---|---|---|---|---|---|---|
| End of 2026 | 43M | $104B | $191B | $238B | $277B | $319B | $404B |
| Mid-2027 | 52M | $126B | $234B | $291B | $338B | $390B | $494B |
| End of 2027 | 71M | $173B | $320B | $398B | $462B | $533B | $675B |
| End of 2028 | 114M | $277B | $514B | $640B | $743B | $857B | $1,085B |
Supply is Epoch's completion schedule times a 3.08 coverage factor and a 90% execution rate, starting from 30M chips as of 2Q26, counted in H100e, so equivalent additions run higher than the GW headline suggests (new-generation sites carry more H100e per GW, on a +40% a year efficiency assumption). The 2028 sensitivity: about 36M chip-equivalents of sites carry a December 31 completion date. If all of it lands on schedule, compute rises to about 147M chips and the ARR needed to touch the lines goes up to $662B and $824B. That is the single biggest uncertainty in the 2028 supply estimate.
Source: Epoch AI (CC BY 4.0); FinSight compilation and estimates
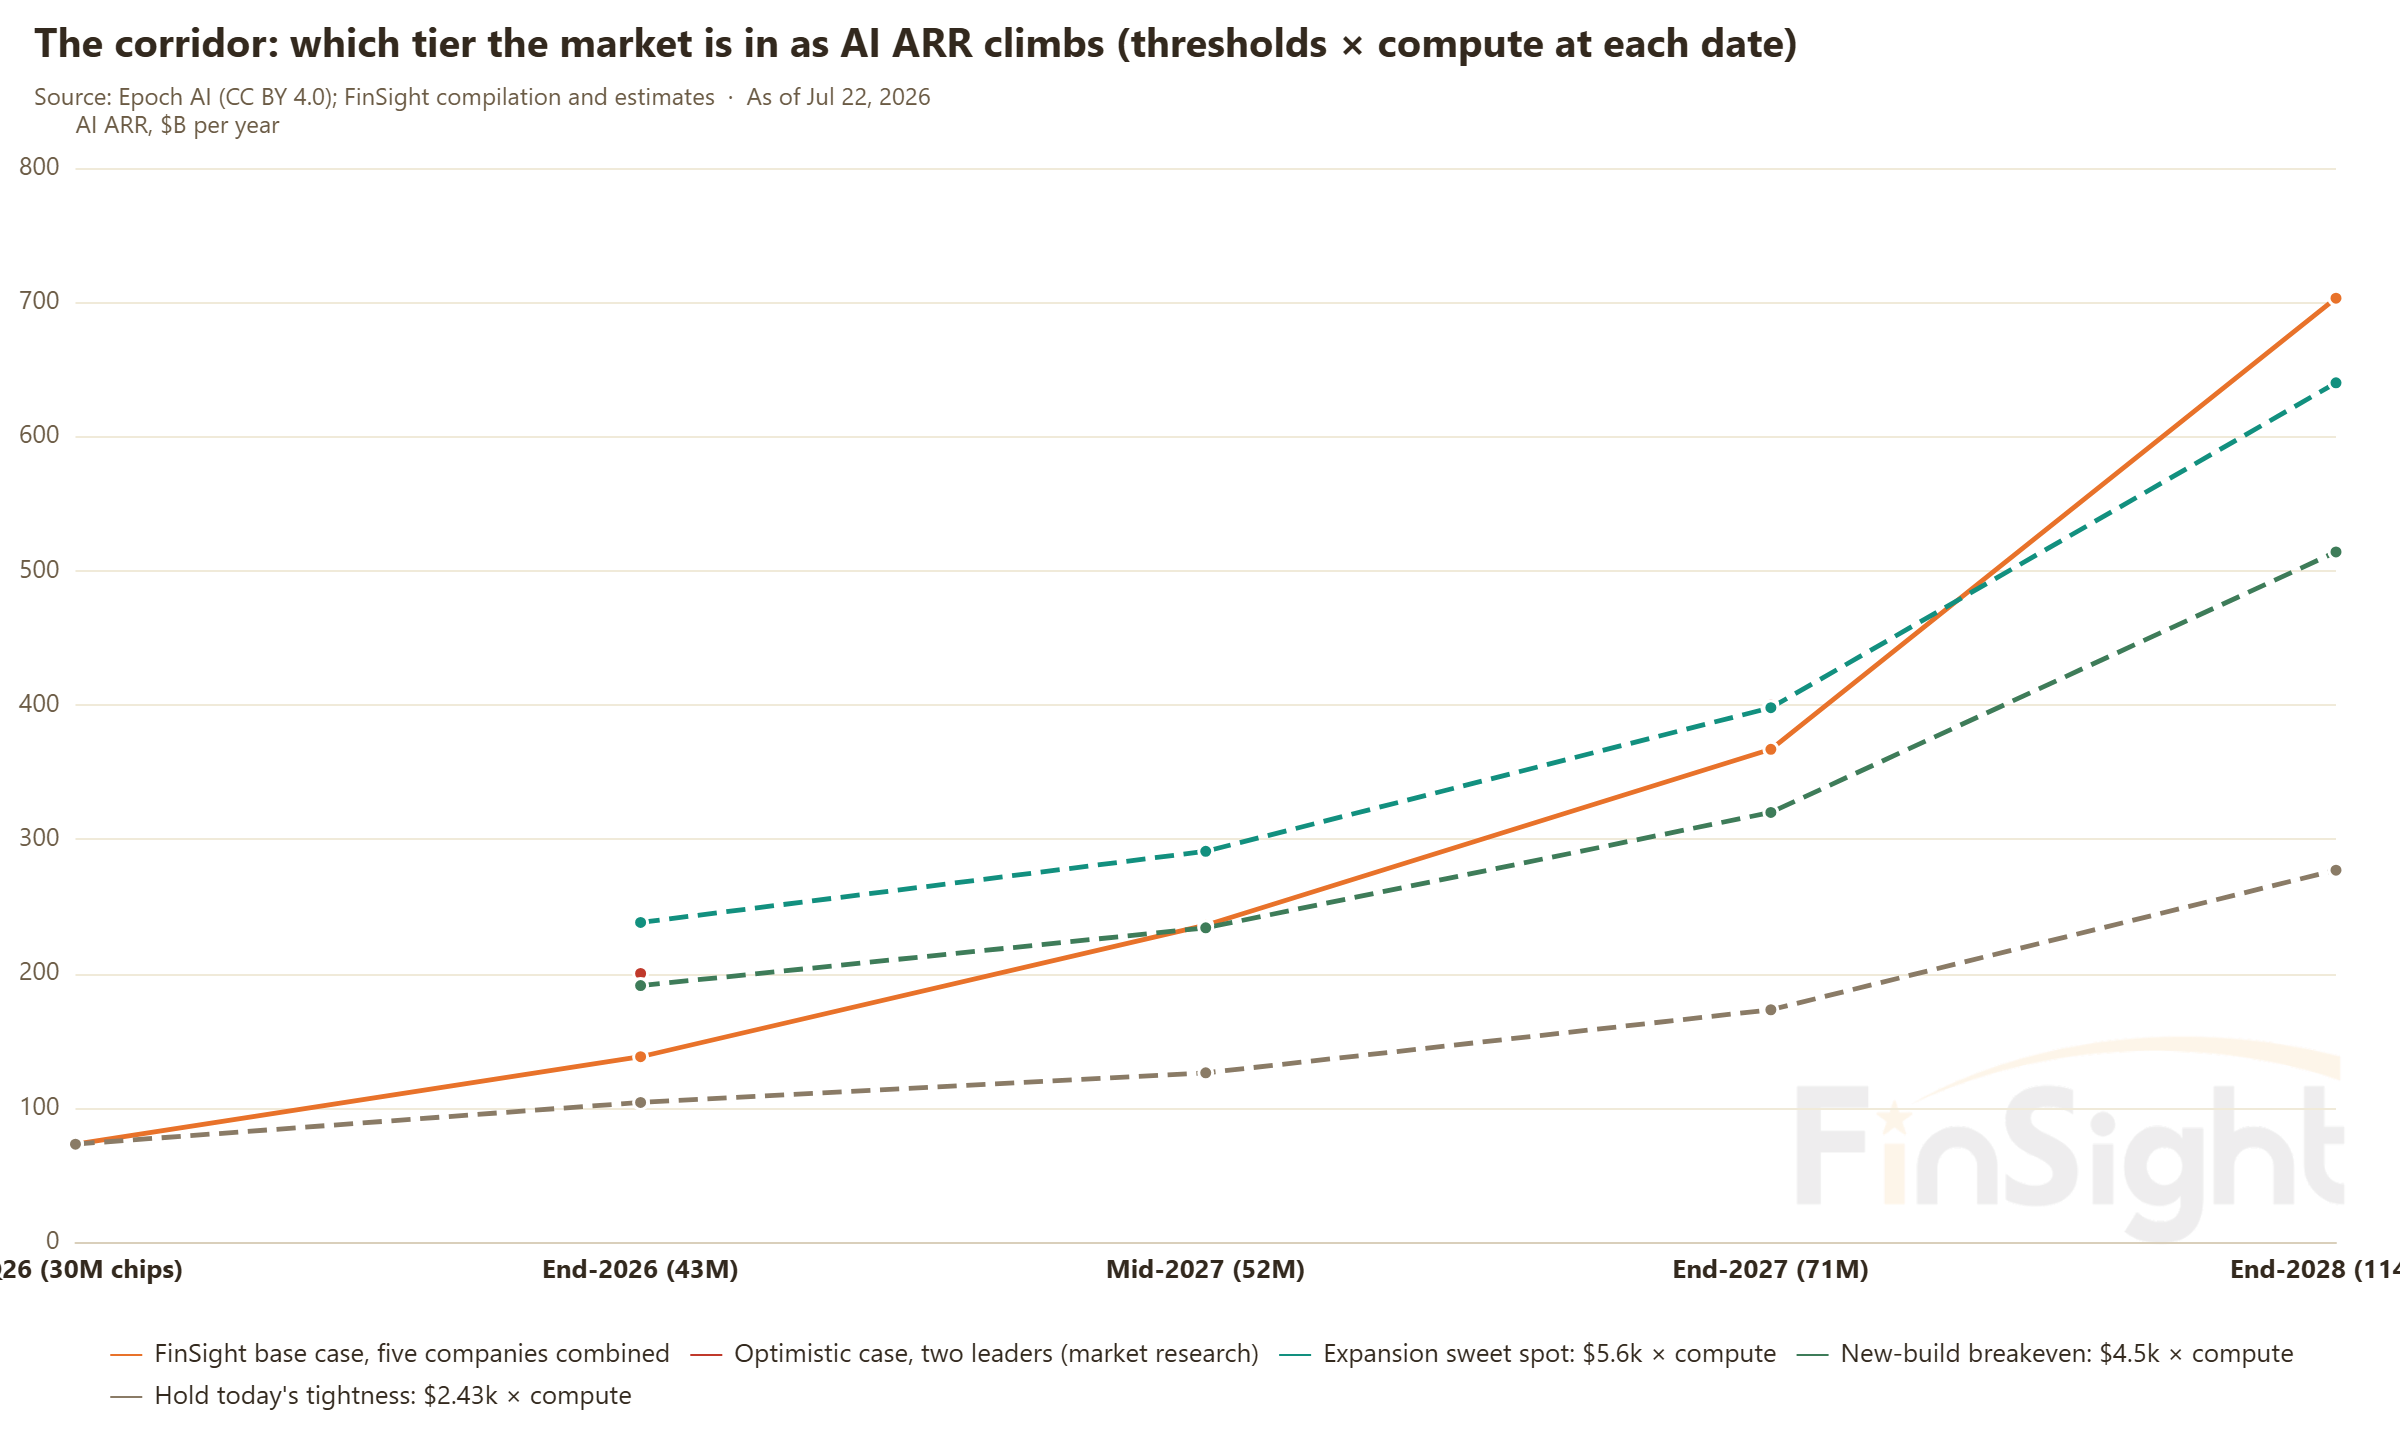
With those three lines backed into, the whole picture turns into a corridor. Looser than today at the bottom, then tighter but new builds still burning cash, then the new-build breakeven zone, and at the top the expansion sweet spot. Wherever ARR sits is the state the market is in.
The read-through: if the five companies' combined ARR is above $191B by the end of 2026, newly built data centers are at breakeven; above $238B, adding capacity on top is a good business too. FinSight's base case touches the breakeven line in mid-2027, at $236B against the $234B needed, and has a shot at crossing the sweet spot in 2028.
Where does the optimistic case land? SemiAnalysis puts Anthropic alone at roughly $150B of ARR by the end of 2026 and $300B by the end of 2027, which takes the two leaders together above $200B and above $400B. Check that against the table: breakeven is reached by the end of 2026 ($200B against $191B) and the sweet spot is touched by the end of 2027 ($400B against $398B). Each is about a year earlier. That one-year gap between conservative and optimistic is what the quarterly scorecard is meant to close.
The quarterly scorecard: AI ARR, and GPU rental prices
We are willing to run this projection this far forward because it has already passed one real-world test. The metric turned at the end of 2025, then rentals repriced in December and the public clouds repriced in January. Both showed up.
From here there are two lines to check. One is ARR against the threshold table every quarter, which tells you how tight compute is overall. The other is faster: GPU rental prices, quoted daily, which give you a live read on how tight or loose the market is.
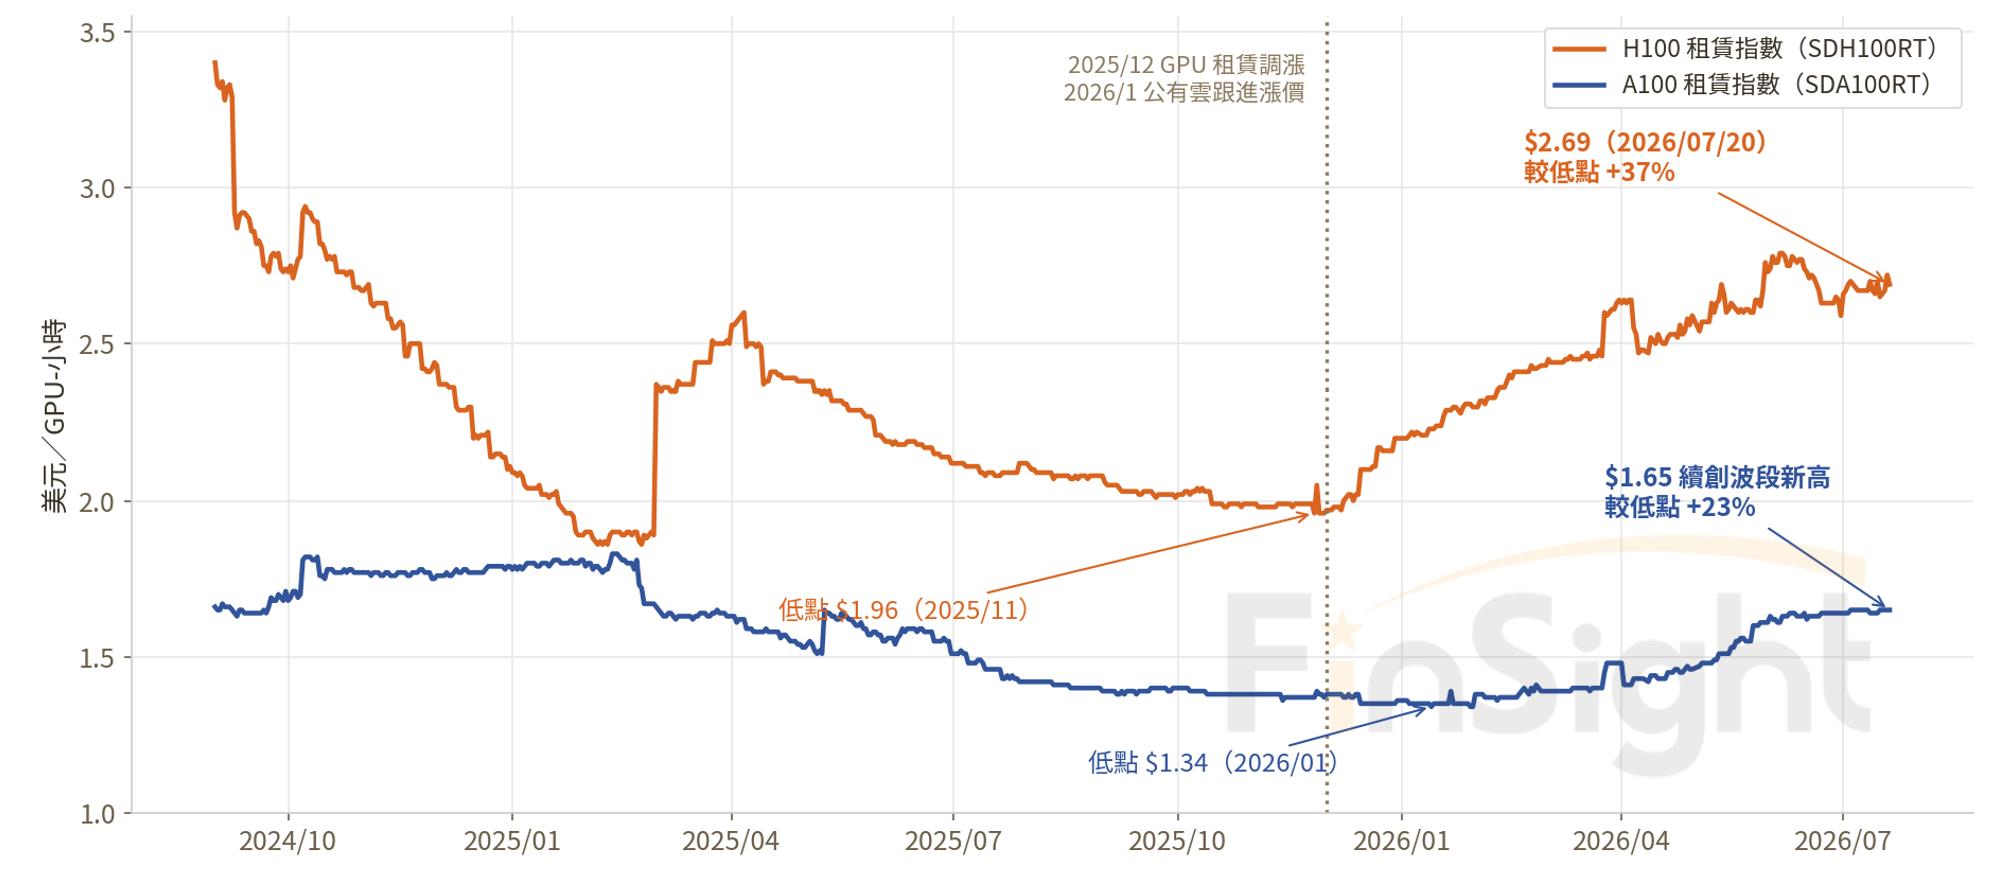
Where we are now: Silicon Data's H100 rental index (SDH100RT) printed $2.69 per GPU-hour on July 20, 2026, which is about $23.6k a year per chip if you keep it running flat out. That is up 37% from the November 2025 low of $1.96, and the timing meshes exactly with the turn in revenue per chip. The more interesting one is the A100. That chip shipped in 2020, and its rent is up 23% off the low and still making new highs for the move, which is the point from step one: a GPU past its depreciation life is still generating cash. And the two leaders' $14k to $18k works out to an effective hourly rate of about $1.60 to $2.05, a little under spot. Big buyers signing long contracts get a discount, so that fits.
How to read it from here: if supply and demand tighten the way this projection says, the rental index should hold a relatively high range through mid-2027. If rents soften noticeably before the 2027 wave of completions lands, that is the earliest warning light on the demand side. One caution: once the new generation (Vera Rubin) ships in volume, the H100 index will not simply keep climbing. Older generations drift down on their own, as the A100 spent all of 2025 in a downtrend and the H100 trended down for the two years before that. So what you watch is the range and the relative move: does it hold the high end, does the decline stop. Once rental indices for the new generation mature, we switch anchors.
Bottom line: everyone is arguing about how much cash AI burns, and the people who own compute are already printing money
Our last post worked out from the supply side how long the shortage runs, which is no relief before the second half of 2027. This post works out from the cost side when the money comes back and how much ARR is good enough, and hands you a threshold table you can check every quarter.
Put them together in one sentence: compute keeps getting tighter, and over the next year, compute is king.
- Two lines matter on the cost side: new-build breakeven at $4.5k per chip per year, and the expansion sweet spot at $5.6k. Monetization intensity today is $2,430 (2Q26), roughly half the breakeven line.
- At the current slope, the base case touches the breakeven line in mid-2027 and clears the sweet spot in 2H28; the optimistic case gets to each about a year earlier. And the cost line is still coming down, so the crossing comes earlier, not later.
- The sold-out market already answered: the two leaders are paying $14k to $18k per chip, more than twice the sweet spot, with what was spent, what was earned and the rental market all pointing at the same place. Compute you can rent out is a high-margin business today.
One thing to be clear about first. Touching the breakeven line is not a switch that turns on a perpetual-motion machine. It is a change in what kind of risk you are carrying. Before the line and after it, you worry about different things.
- Before the line, watch the financing chain. The whole industry is still burning cash and the hole in the middle gets filled with financing, so the biggest risk in this stage is that funding breaks before the payback arrives. Other variables to watch: AI ARR growing slower than expected, which turns the 2028 completion wave from a supply peak into a glut; rental prices going soft before supply ramps, the earliest warning light on the demand side; HBM and component prices pushing the cost band up; and the consensus on depreciation life moving shorter, which lifts the thresholds by more than 40%.
- After the line, watch the capacity cycle. The business earns on its own by then, and the risk swaps to: good money, everyone races to expand, new supply dilutes revenue per chip, returns get pushed back down to the cost band. What you watch then is which end of the cycle the spread is at. Widening is when you want to be long. Compressing is when you get careful.
Nobody can call how the script plays out. But the method is simple: every quarter, put actual ARR and the rental index back on the table. When the data changes, we change with it.
In the next post we go back and answer the three worries the market has been carrying for six months: that open source has caught up, that a small model plus a workflow is good enough, and that enterprise token spend has a ceiling. None of that is the end of demand. It is the start of deployment.
Sources: Epoch AI, AI Chip Sales, AI Companies and AI Data Centers (CC-BY 4.0); Epoch AI Data Insight, May 14, 2026 (the 1GW TCO model); SemiAnalysis financial reconstruction of Anthropic, July 8, 2026; Silicon Data GPU rental indices (SDH100RT and SDA100RT). Every calculation here can be reproduced from public data.