
AI compute stays short at least through 2H27, with data center additions thinning to 1.41GW in 1H27, adding just 8.9% to the installed base.
At the end of our last post, the one-year check, we said the first thing we would write about after coming back was compute supply and demand. We picked it first because it matters more than anything else on the list. Every AI argument of the next twelve months (bubble, payback, who captures the profit) comes back to compute supply.
Key takeaways
- Data center completions go thin in 1H27: only 1.41GW, adding just 8.9% to the installed base, the smallest step-up since 2023.
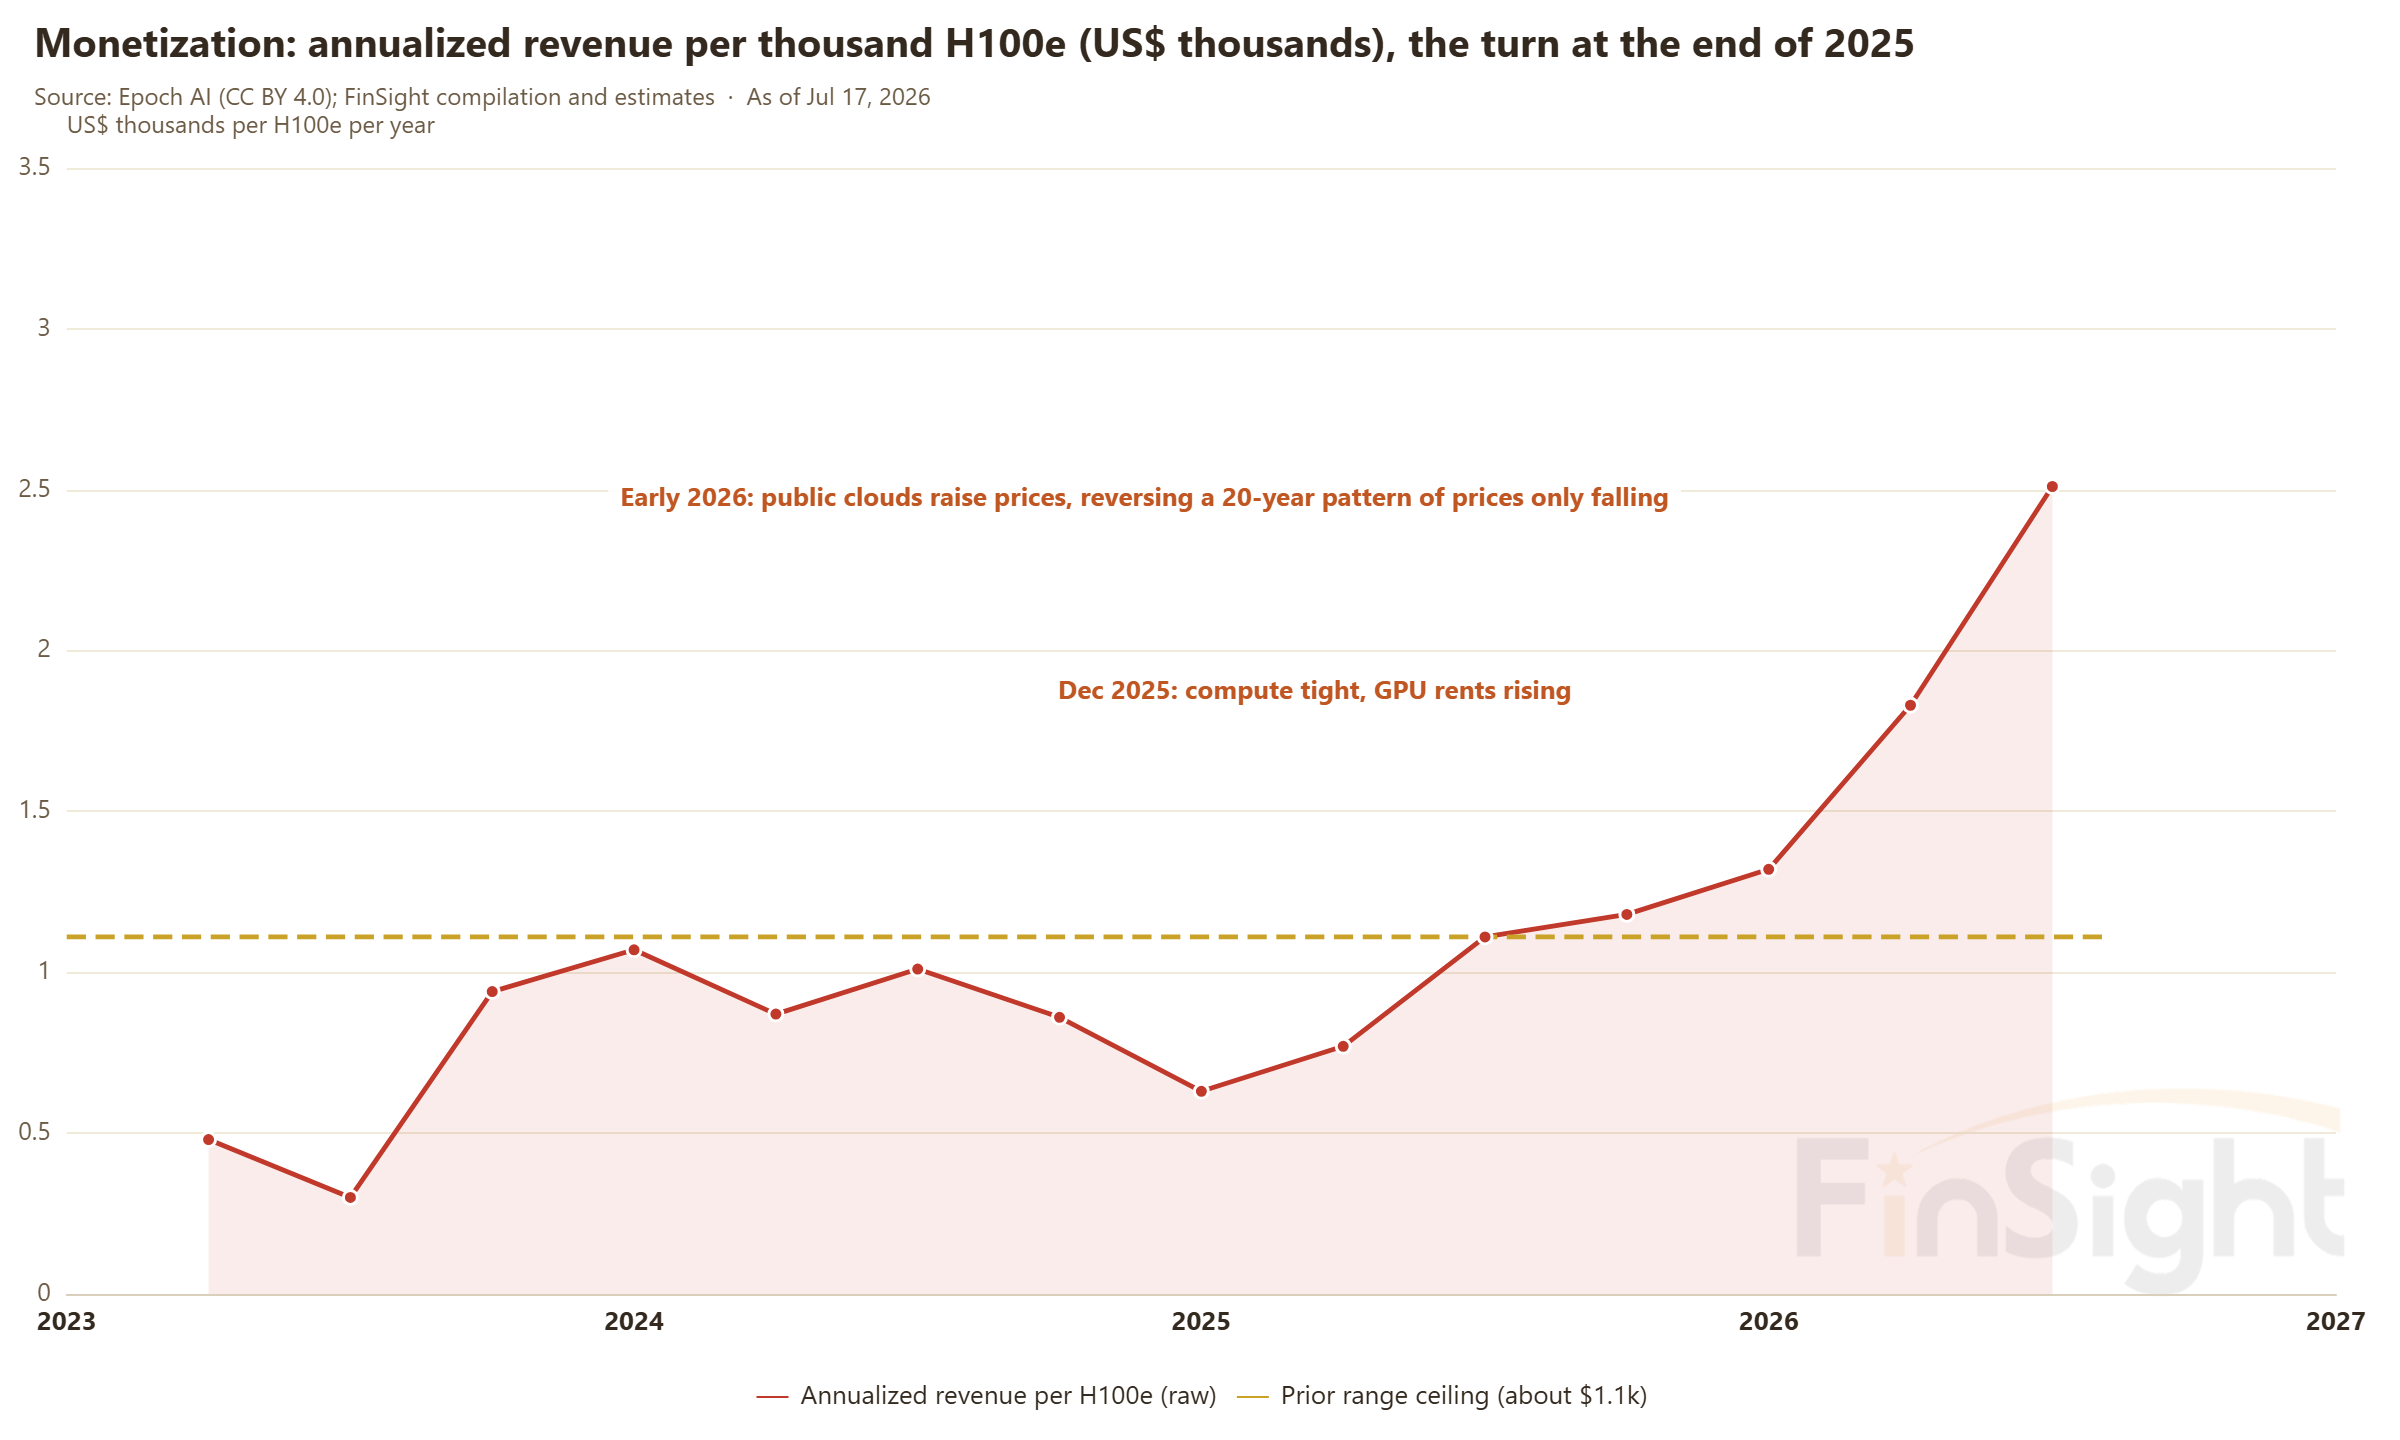
- Annualized revenue per H100e jumped 84% from 4Q25 to 2Q26, $1,318 to $2,430, confirming December's GPU rent increases and January's cloud price hikes.
- Compute stays short at least through 2H27, and the gap tops out around mid-2027, well above today's $2,430.
- Compute is king: Meta (1.90M H100e) and xAI are renting reserves into the tightest market yet, not dumping surplus.
Plenty of people are worried: bubble, enterprise pullback, peak demand, too much compute. Lately some people have even read Meta and xAI renting out their compute as an early sign of oversupply. We answer that one directly in the second half of this post. But on the compute market itself, the consensus is actually that it is short. The real disagreement is over how long it stays short. This post answers that question with data: we set the revenue curve on the demand side against the capacity schedule on the supply side.
In December 2025, GPU rental prices moved first. In January 2026, AWS raised prices and Google Cloud followed. A public cloud price increase breaks a twenty-year pattern in which cloud prices only ever went down. Most people treated it as a one-off. After putting the two data sets side by side, our view is different: this was not an event, it was the start of a turn. Supply stays tight at least through the second half of 2027. Today's price hikes are the early innings; 2027 is where the game is decided.
Exponential AI demand meets a supply schedule that goes thin in 1H27
Start with demand. Anthropic's annualized revenue went from $9B on December 31, 2025 to $47B on May 15, 2026, in five and a half months. OpenAI's latest disclosure was $25B as of February 28, 2026. This demand curve is still climbing exponentially.
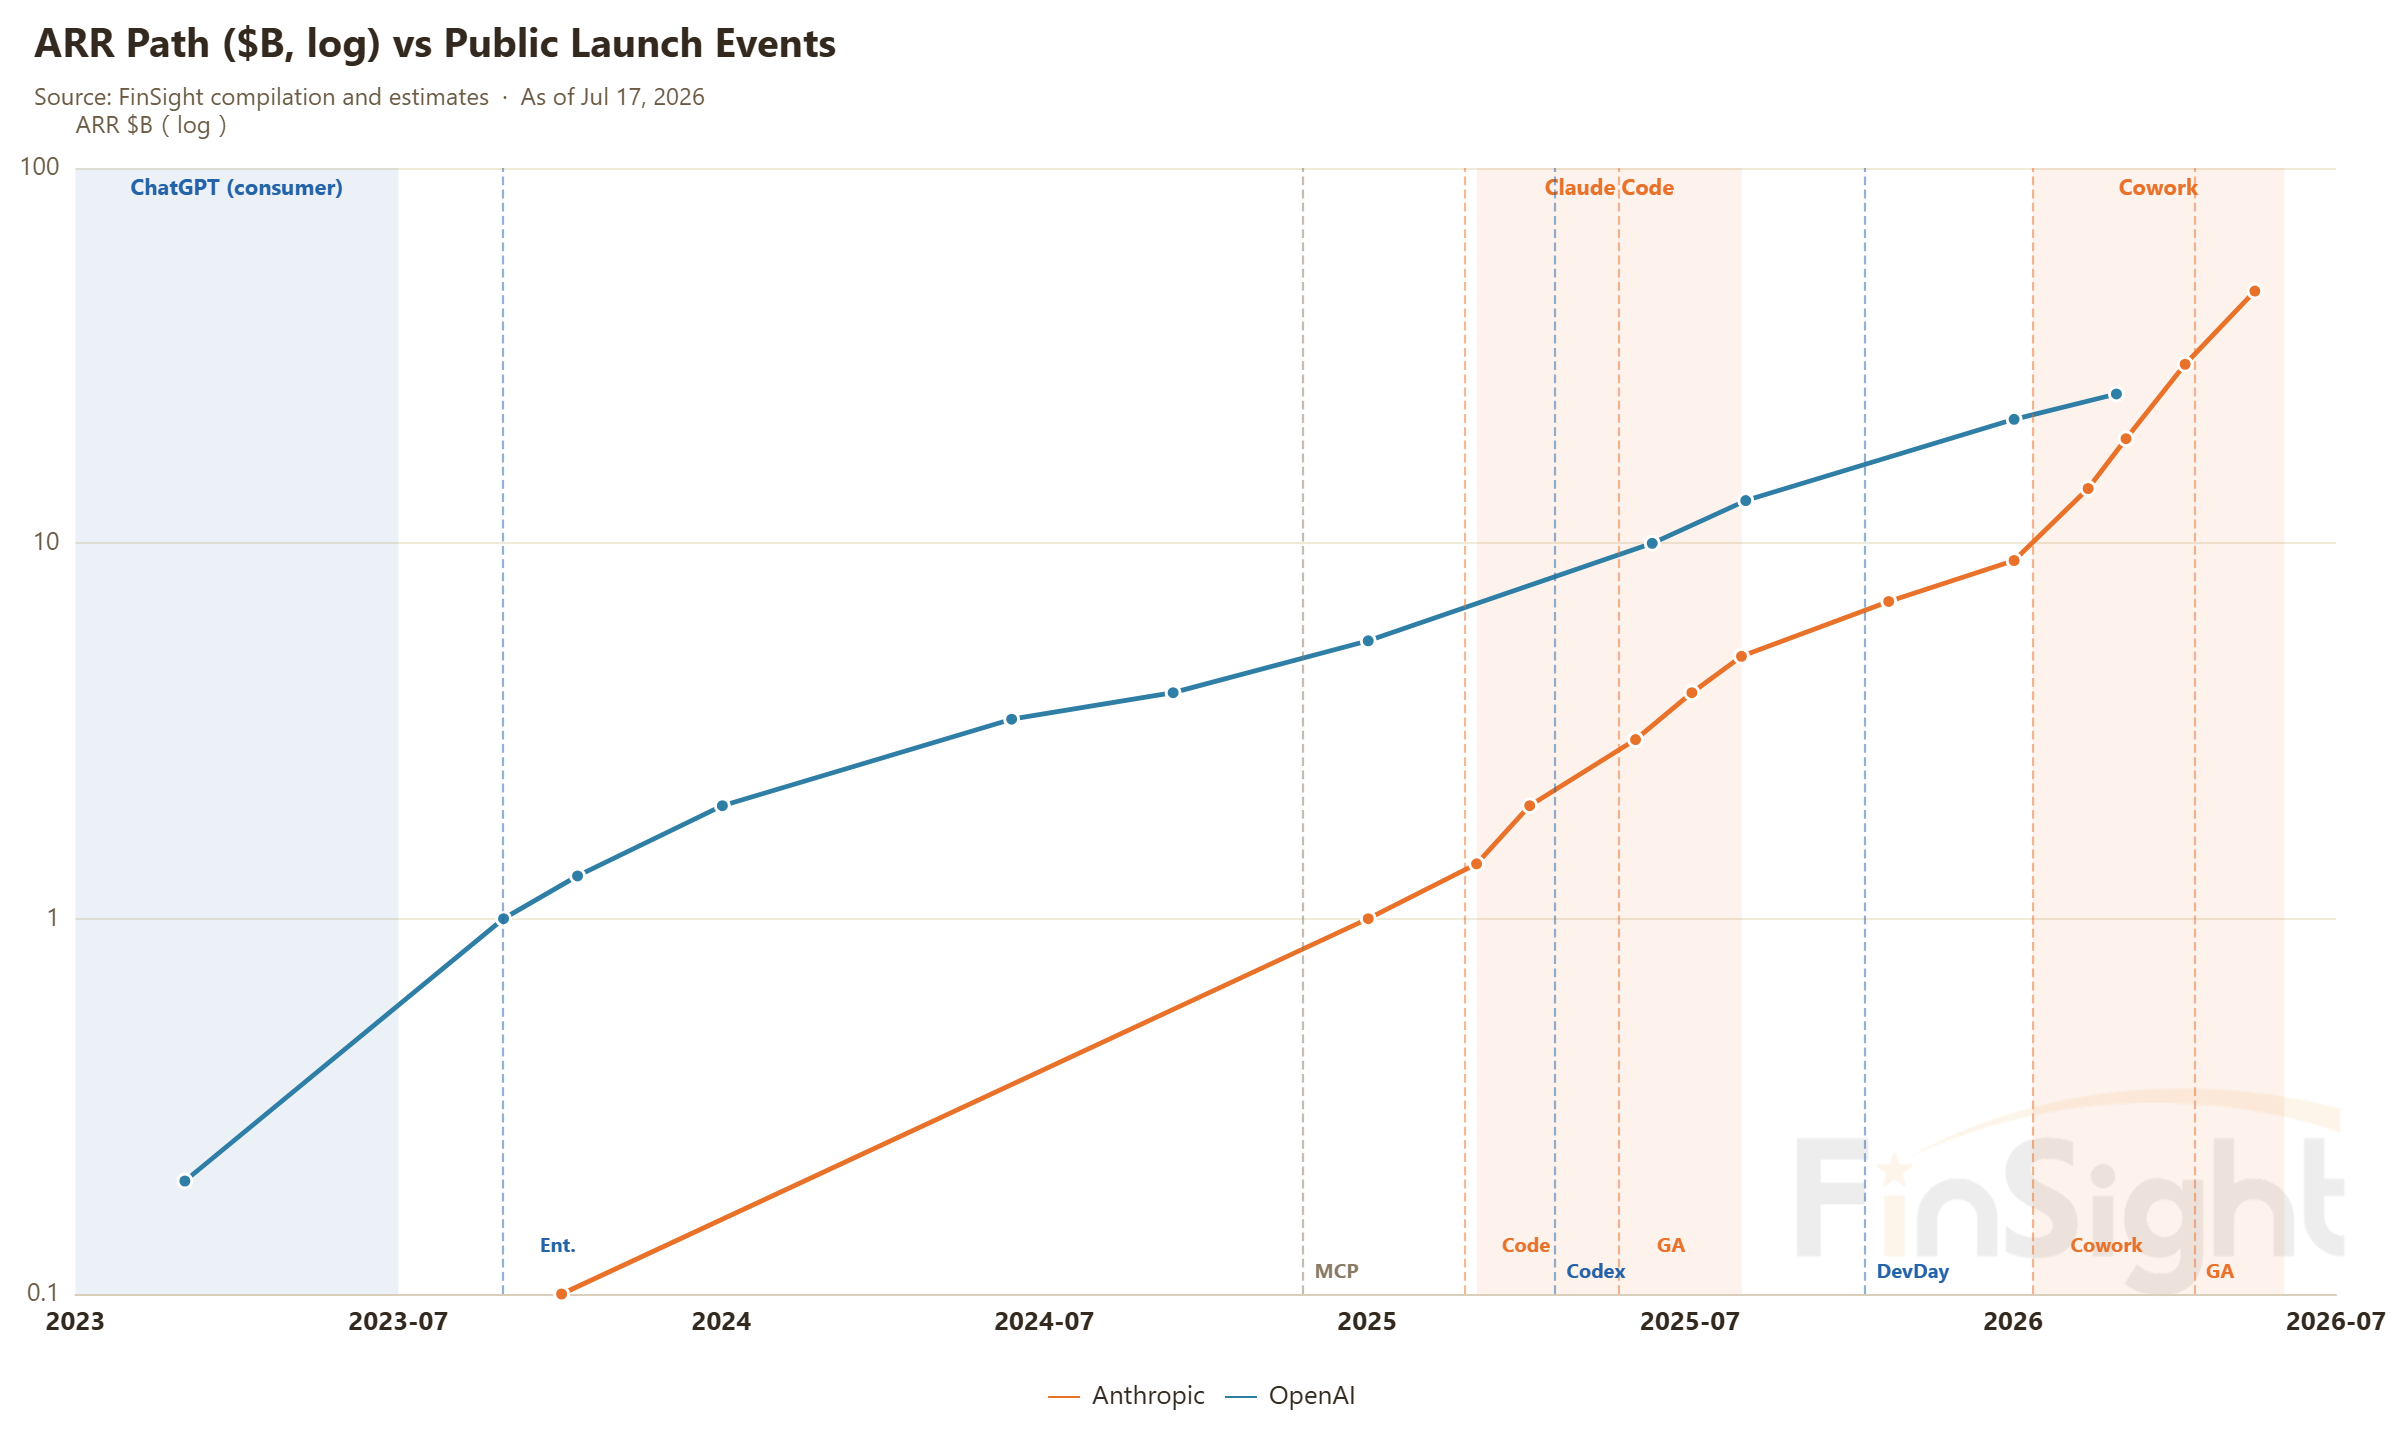
How high this curve can go, and what level of AI revenue counts as good enough, is what the market is arguing about. That is the next post. The question here is simpler: can supply keep up?
On the supply side we took the completion schedule of every data center Epoch AI tracks as under construction and summed it by half-year. The first half of 2026 adds 4.92GW and the second half 3.94GW. The first half of 2027 adds only 1.41GW, which adds just 8.9% to the installed base, the smallest step-up since 2023. Even the 3.66GW coming in the second half of 2027 is smaller than either half of 2026. The supply curve has a gap in 2027. If demand stays on its current path, compute in 1H27 will be badly short.
Only sites already under construction are counted, so the schedule thins after 2028 for visibility reasons, not because supply stops.
| Half-year | New capacity (GW) | Cumulative (GW) | New as % of installed base | What was going on |
|---|---|---|---|---|
| 1H23 | 0.17 | 0.2 | 77.6% | Fast build-out; assembly makers benefit |
| 2H23 | 0.08 | 0.3 | 27.5% | |
| 1H24 | 0.45 | 0.7 | 60.3% | Public cloud profits turn up |
| 2H24 | 0.74 | 1.5 | 49.9% | Market worries about the return on investment |
| 1H25 | 1.59 | 3.1 | 51.8% | DeepSeek scare; fears of price cuts |
| 2H25 | 2.51 | 5.6 | 44.9% | Demand surge after Claude Code launched in May |
| 1H26 | 4.92 | 10.5 | 46.8% | Anthropic revenue explodes |
| 2H26 | 3.94 | 14.4 | 27.3% | |
| 1H27 | 1.41 | 15.9 | 8.9% | Very little new capacity comes online |
| 2H27 | 3.66 | 19.5 | 18.8% | |
| 1H28 | 7.15 | 26.7 | 26.8% |
Dates are when each block of capacity comes online: past dates verified by satellite imagery, future dates are Epoch's estimated completion. Only sites already under construction are counted. The last column is each half-year's additions as a share of the installed base at the start of the period.
Source: Epoch AI (CC BY 4.0); FinSight compilation and estimates
Is the money going into AI paying off?
The bubble worry never goes away, so here is our simple way to test it. Take AI revenue at the very top of the stack as the payoff (the numerator), and compute at the very bottom as the input (the denominator), and see whether the input is earning its keep.
The core metric is annualized revenue per H100e: the combined revenue of the five largest model companies divided by the market's total installed stock of H100-equivalent compute. Put simply, it is how much money each unit of compute is earning right now. When it shoots up, demand is growing faster than supply and compute is getting more expensive. When it falls back, supply has caught up and the market is loosening.
The denominator, H100e, means H100-equivalent chips. Every AI chip in the market, NVIDIA GPUs, Google TPUs, AWS Trainium and the other custom ASICs, gets converted into "how many H100s is this worth" on compute performance, then summed. A newer chip is stronger, so one of them counts as several H100e. The conversion uses Epoch AI's chip shipment and performance data. It is an estimate based on spec sheets, not measured throughput, but it is good enough to read the direction and the turning points.
The numerator is the observable annualized revenue of five model companies (OpenAI, Anthropic, xAI, Mistral, Zhipu), meaning figures that have been publicly disclosed and can be compiled. This clearly undercounts: Google's Gemini revenue sits inside its subscriptions and search ads, the cloud providers' own AI services are not in it, and neither is the money Meta makes running its recommendation systems on this compute. But undercounting makes the conclusion stronger, not weaker. With only part of the numerator captured, the metric is already surging. What matters is that the definition stays consistent over time; we are reading direction and turning points, not the absolute level.
Look at the history first. The metric turned up at the end of 2025: from 4Q25 to 2Q26 it jumped 84%, from $1,318 to $2,430. The timing lines up exactly with GPU rental prices rising from December and AWS and Google Cloud both raising prices in January. The metric called it before the price hikes did. That is why we are willing to run it forward.
Above $2,430, today's level, means tighter than now.
Now push it forward. For the projection, revenue under our scenario is divided by Epoch's completion schedule. How to read it: above $2,430 (today's level) means tighter than now, and the price-hike environment continues.
Projection assumptions: Epoch's completion schedule scaled by a 3.08x coverage factor and a 90% execution rate; model-company revenue starts at +300% a year and decays to +55%, with +40% efficiency gains; projected to the end of 2028.
The projection says 1H27 is the half-year with the least new capacity, and the gap tops out around mid-2027.
On a straight-line extrapolation, revenue per unit of compute in mid-2027 blows through today's $2,430 high. Compute will be tighter than what we are living through in this round of price hikes. The supply-demand structure keeps the price-hike environment going at least until then, and the scarcer it gets, the harder the scramble. That psychology could push it into genuinely bubbly territory. The real reversal signal to watch for comes after 2H27, when large amounts of capacity come online in 2028: then the question is whether demand holds up well enough to keep this number from falling back.
Compute is king: Meta and xAI renting out capacity is a response to a structural shift
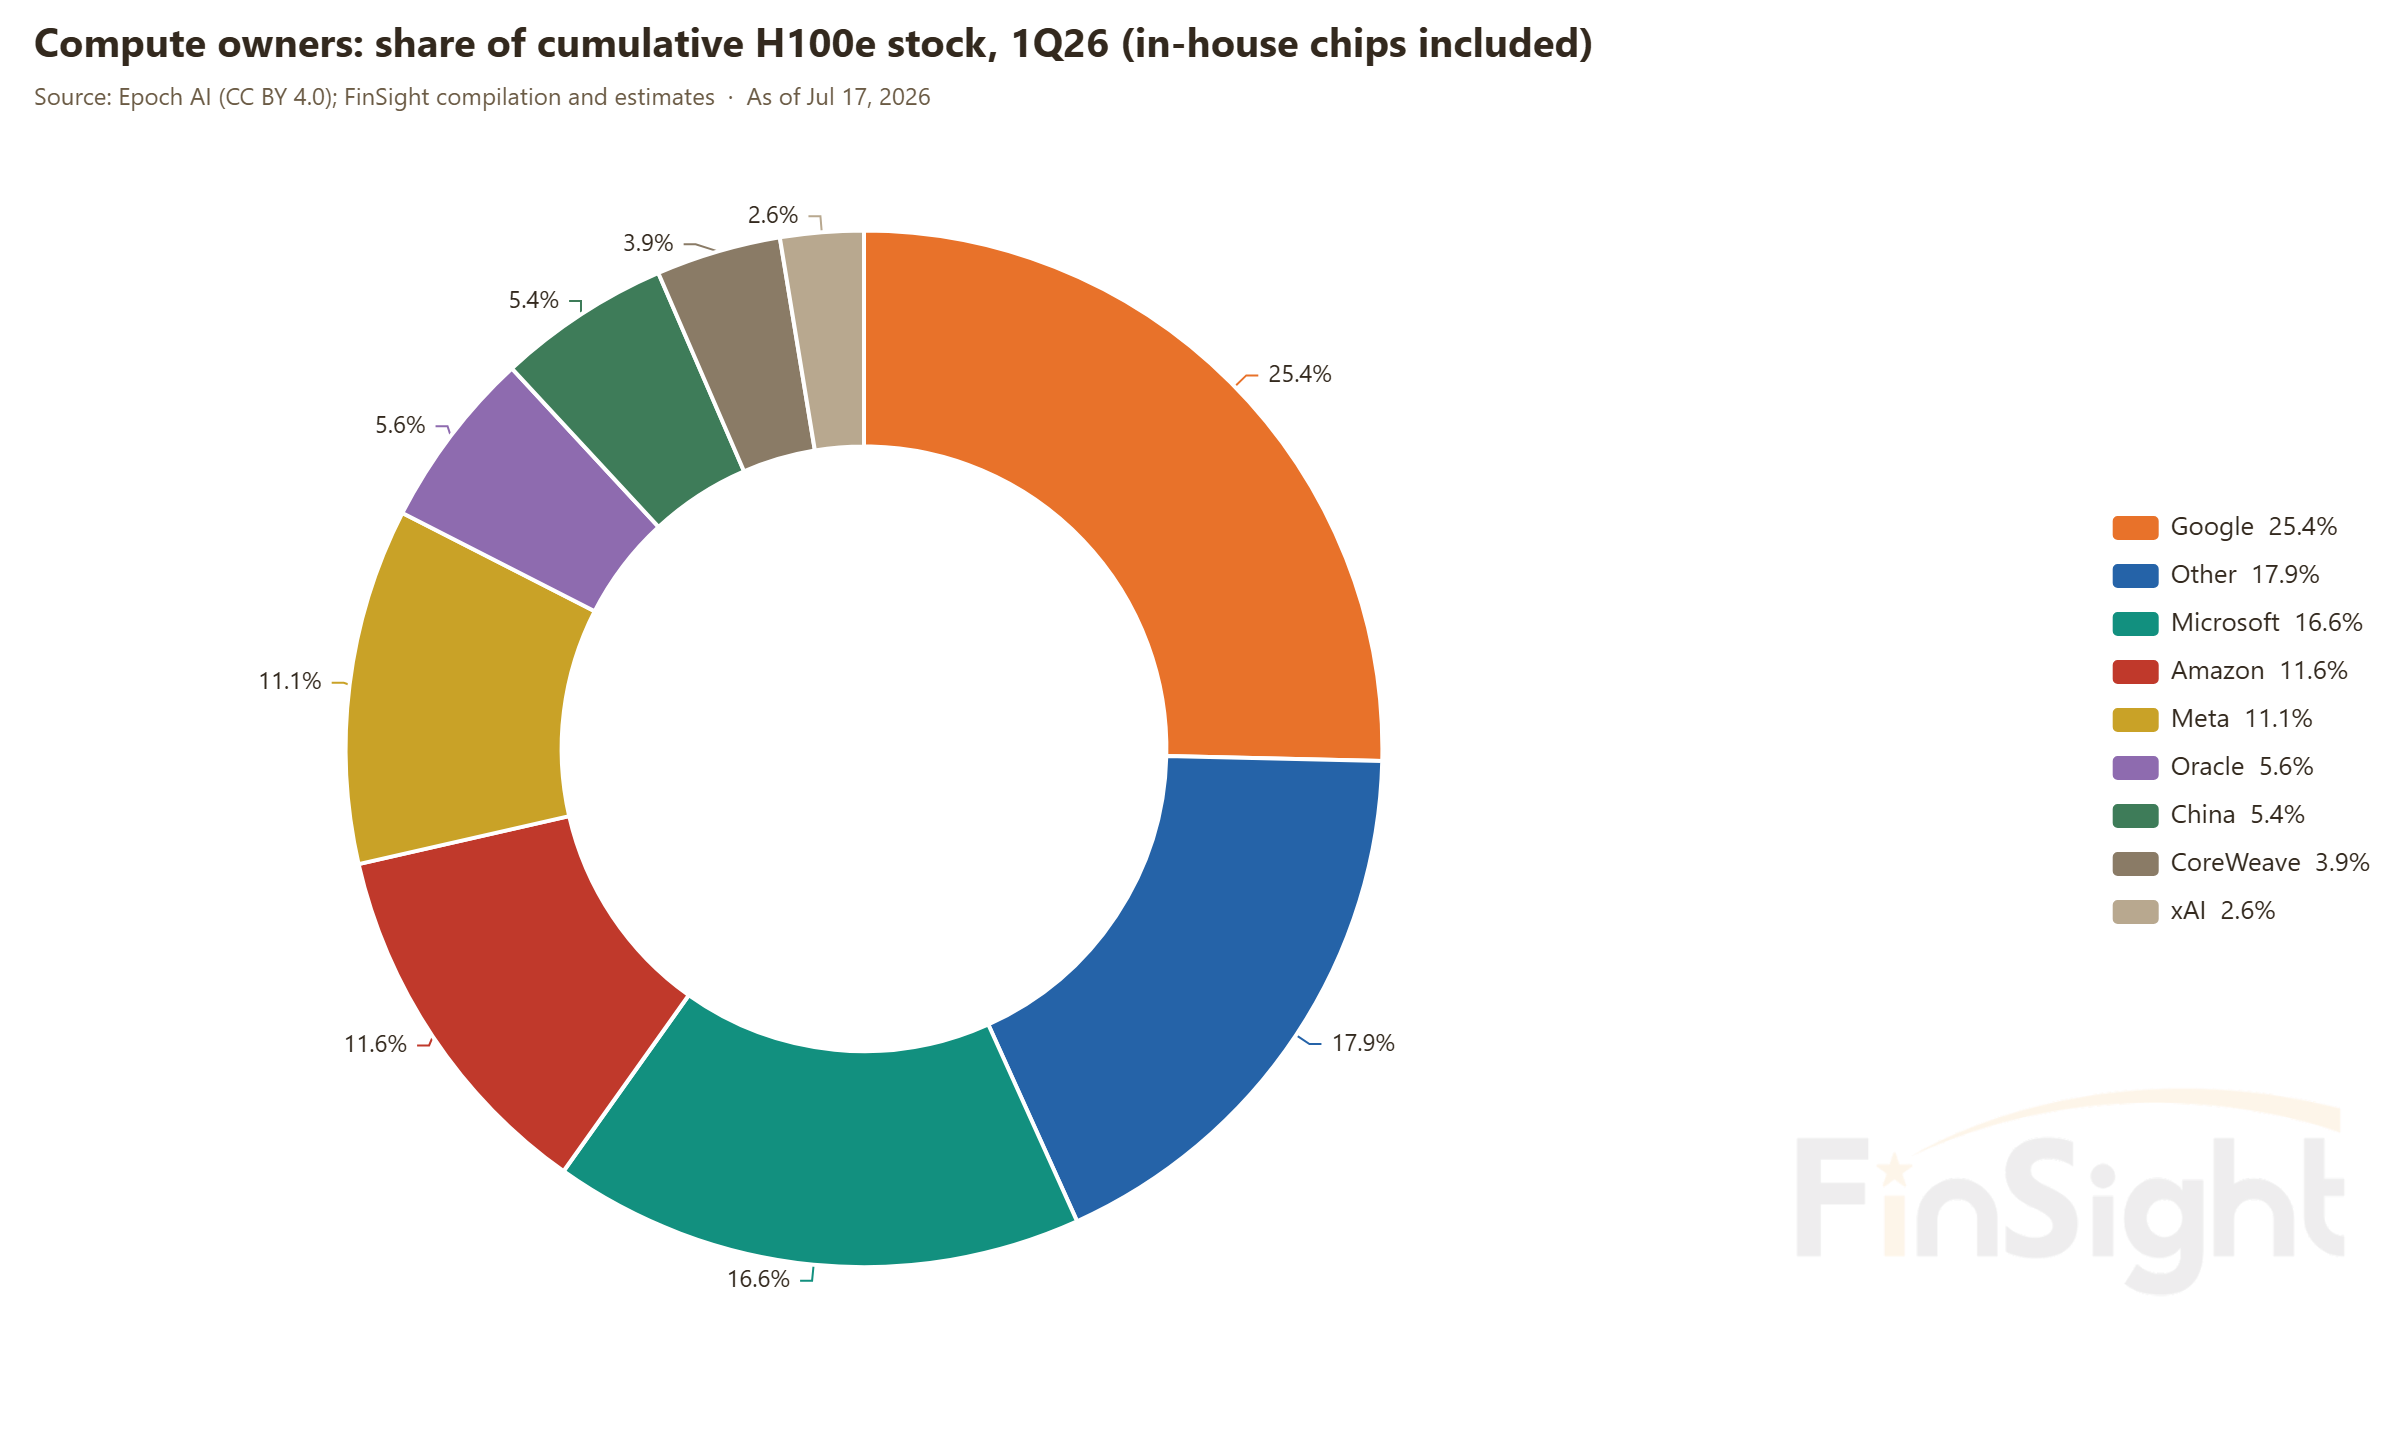
If you accept the argument above, then the first public cloud price increase in twenty years, which we saw at the start of this year, is not a short-term blip but a structural change in the industry. Over the next year, holding compute will be worth a great deal. So it pays to go back and look at who owns compute versus who uses it. Whoever holds reserve compute beyond their own current needs holds the pricing power.
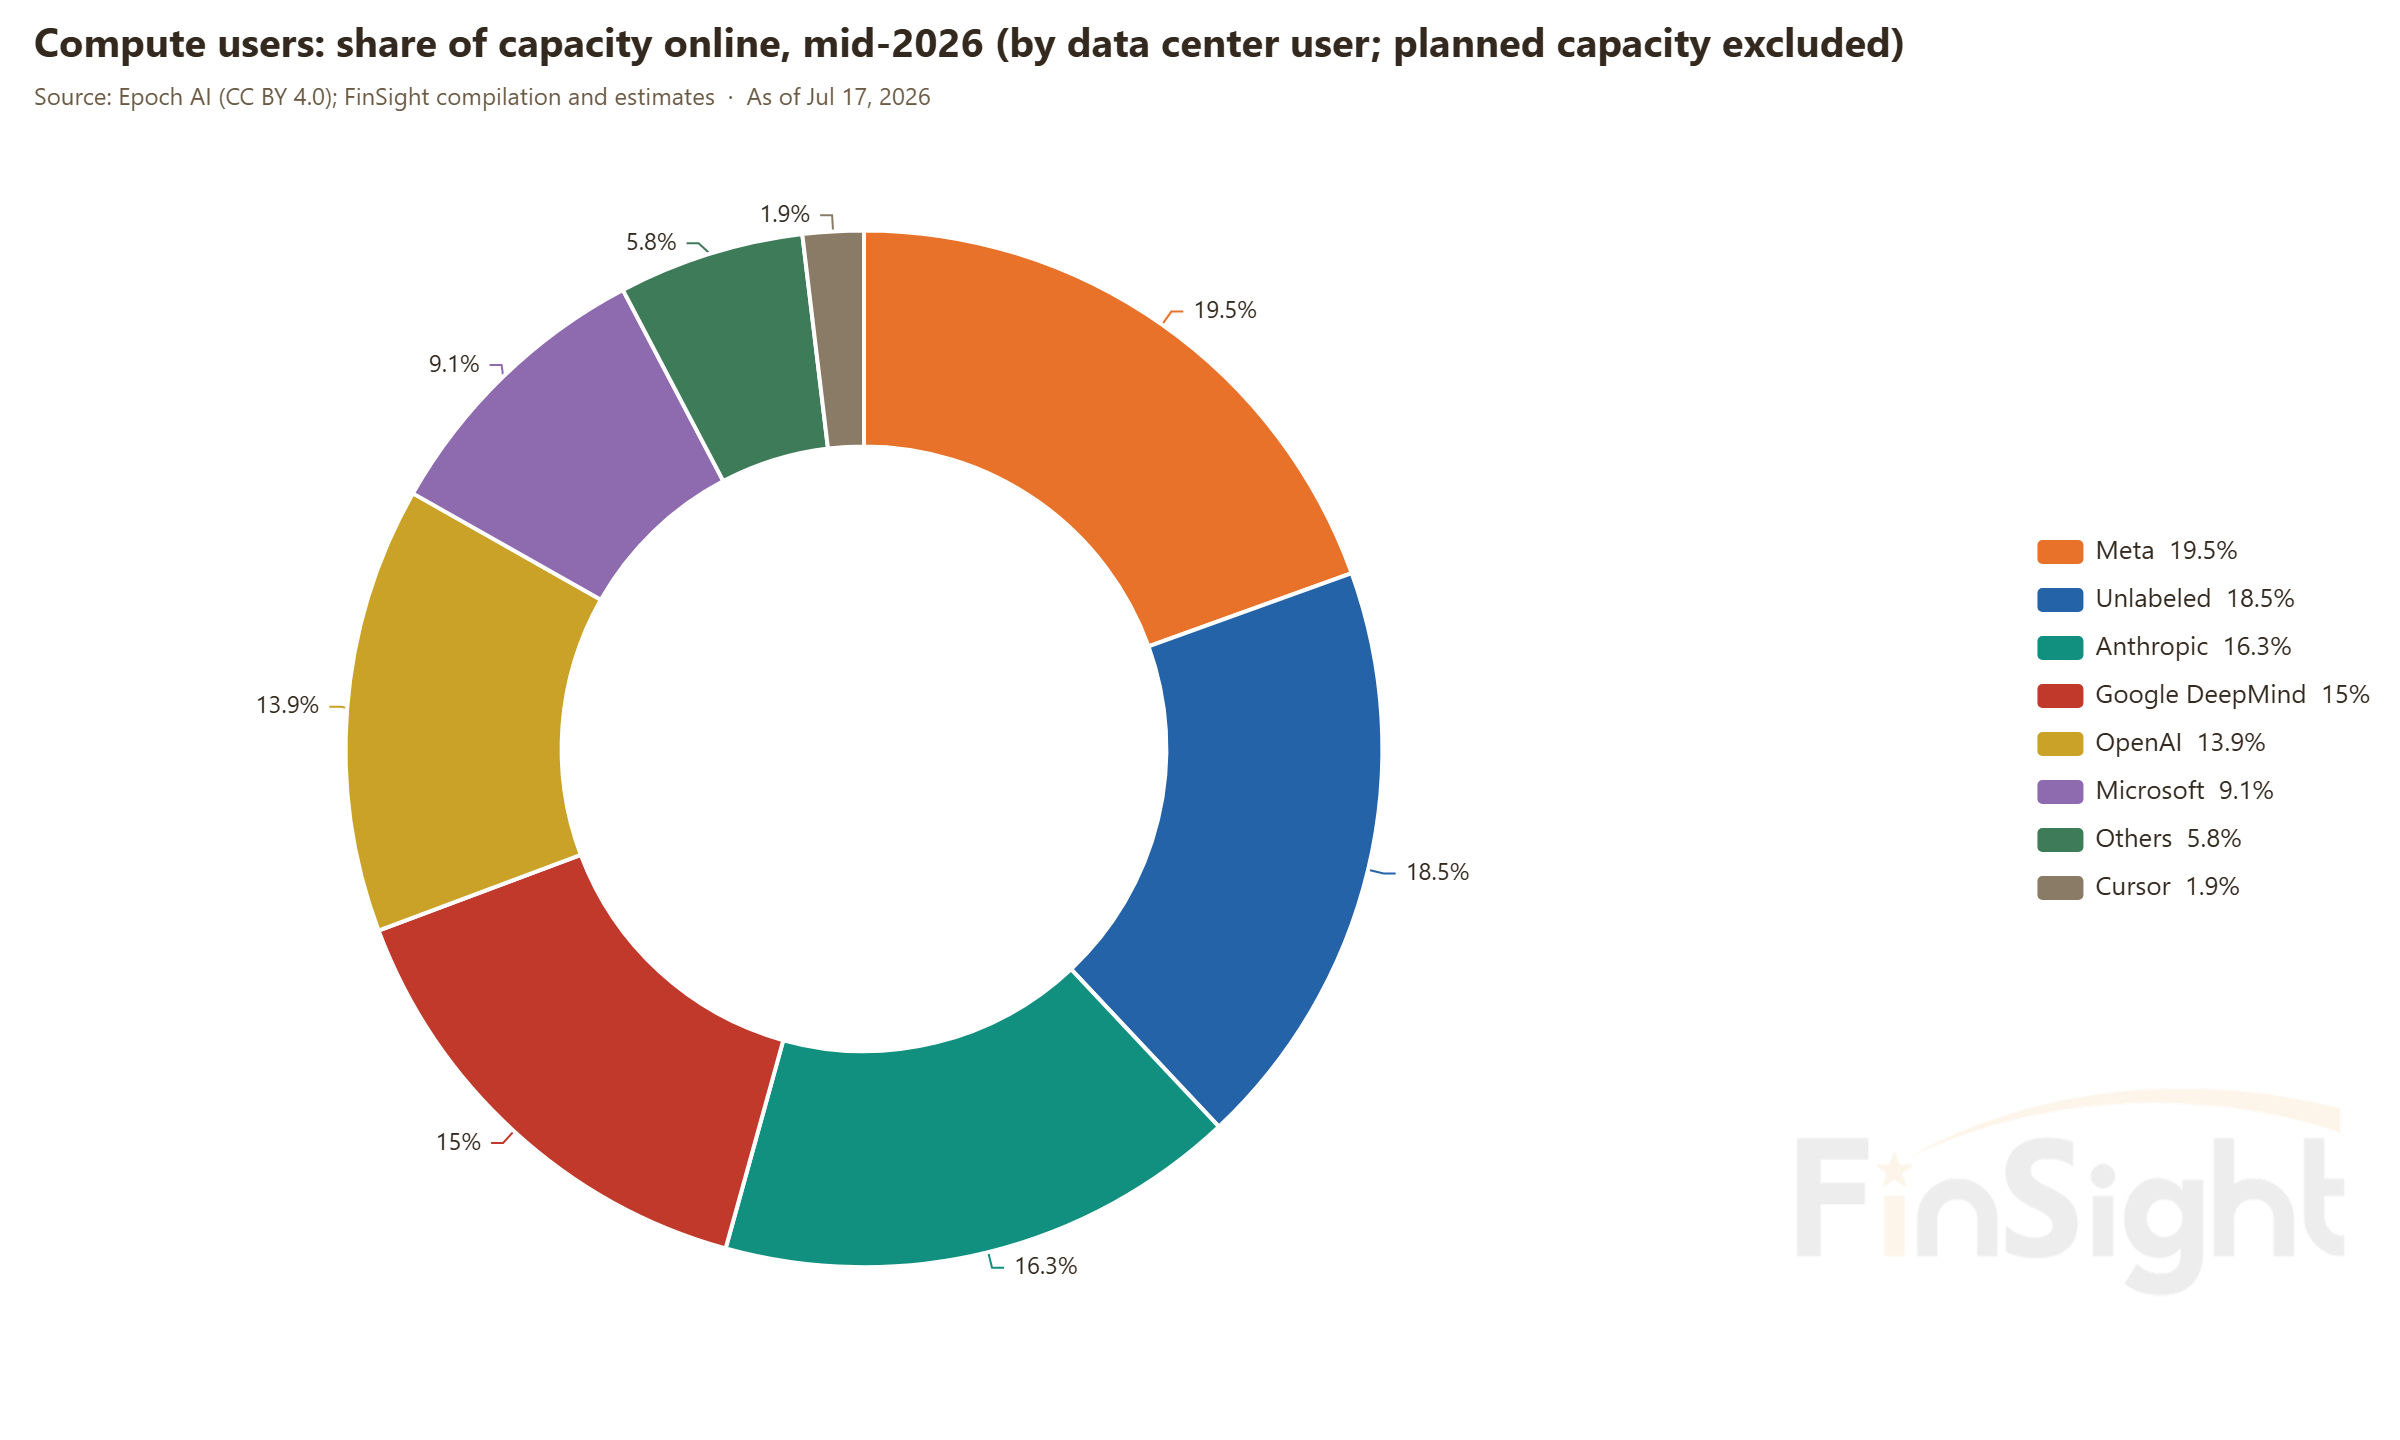
- By chip ownership, Google is the largest holder in the market, at roughly a quarter. But summed by user, Meta is the largest at 1.90M H100e, roughly level with Anthropic at 1.87M. Meta is the single biggest user of compute.
- On locking in future compute: OpenAI is the most aggressive over the long run (though the capacity it can actually bring online before 2028 is limited). Anthropic is clearly under-reserved and will have to buy from xAI, Meta or someone else.
- The three public clouds, AWS, Azure and Google Cloud, still hold the largest share of cloud compute, but Meta itself owns a lot. With public cloud economics visibly improving, if Meta really does have spare capacity to put out for extra profit, it has a real shot at a second revenue engine.
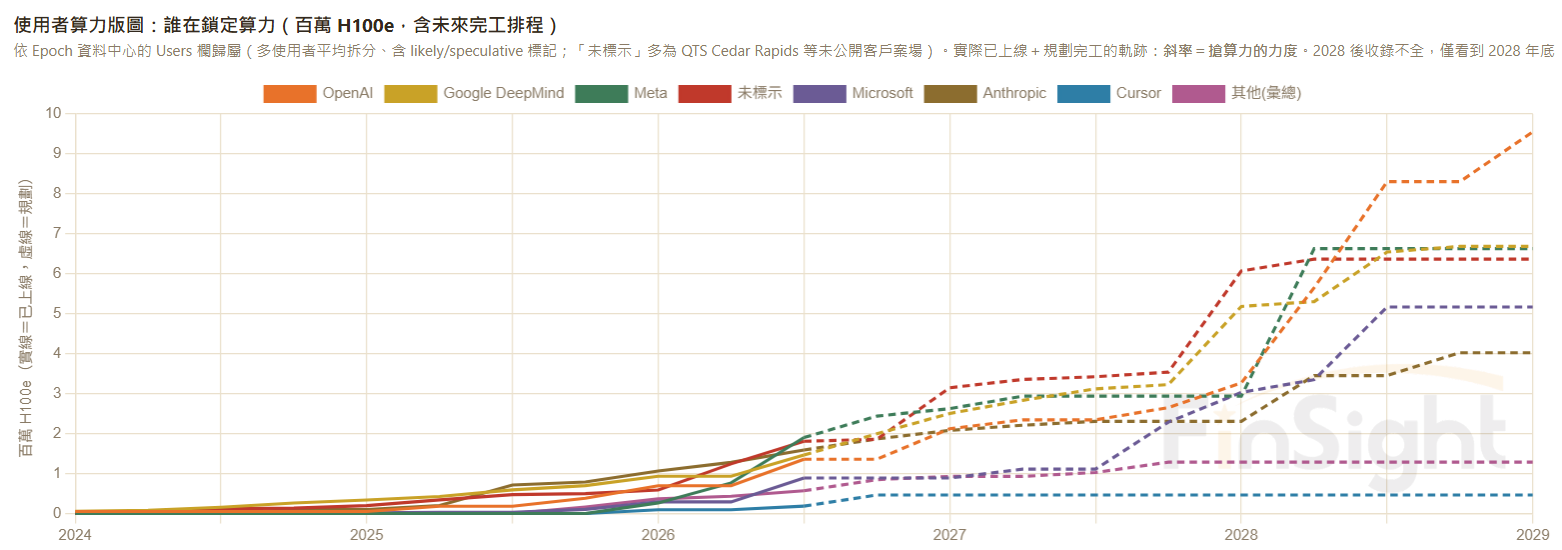
Some read Meta and xAI renting out compute as financial strain, an early warning of oversupply. Two tests say otherwise.
- First, price. A seller under financial pressure cuts price to move volume. What we see instead is the side that is short of compute paying above market rates to lock in rentals (the specific numbers are laid out in the next post). That is buyers scrambling for supply, not sellers looking for an exit.
- Second, volume. Renting out capacity does not add a single chip to the market's total. It just turns self-use reserves into supply that trades. What can be released in the short run is a single-digit percentage of the installed base, while the 2027 supply gap is measured in gigawatts. More fundamentally: if the released compute is snapped up immediately by whoever is short, that is evidence of strong demand, not of surplus.
So our reading is the opposite. Meta's and xAI's shift toward renting out cloud capacity may mark them as the underappreciated winners of the coming year. Both are sitting on large reserves right now (Meta built ahead of demand for its recommendation systems and model training; xAI's cluster build-out has run far ahead of what its own revenue needs). In an environment where compute keeps getting more valuable, selling or leasing out those reserves could generate profit the market has not priced in at all. They are, in effect, the sellers who are long inventory at exactly the moment compute is most expensive.
Bottom line: compute gets scarcer from here, and the market has not caught up
- From past data center completions plus chip shipments, we built the installed compute stock (in H100-equivalent chips) and set it against the AI revenue that can be observed at the top of the stack, to see how much each GPU is earning. That metric turned up at the end of 2025, matching GPU rental prices rising from December and AWS and Google Cloud both raising prices in January, the change that broke the cloud market's twenty-year pattern of prices only falling.
- Looking ahead, the construction schedule says 1H27 is the point where the least new capacity comes online, and even 2H27 adds less than either half of 2026. If compute demand keeps growing, 2027 will see the monetization curve keep rising and a shortage well beyond what we are living through now.
- By who has locked in capacity: OpenAI has mostly reserved capacity that comes online after 2028; Anthropic has not reserved enough; and among users, Meta holds a very large share. If the compute market is as tight over the next year as we expect, Meta's and xAI's move to rent out capacity is a response to this structural shift. Whoever holds compute could earn outsized profit through the tight year ahead.
Risks: the system self-corrects, so here is what would tell us it already is.
- Supply-side signals. As revenue per unit of compute keeps improving and returns on capital rise, that pulls in new data centers, earlier completions, capacity reallocation, higher utilization, more custom chips, and more mid-size sites that are not yet in Epoch's sample. The 2027 gap could get filled faster than the schedule says.
- Demand-side signals. If the two leaders' revenue lands below the bottom of our projection band for two quarters running (especially a cliff caused by losing a single large customer), the demand curve has to be redrawn.
- Price signals (the final arbiter). GPU spot rental prices softening before new supply lands, on-demand capacity going from sold out to freely available, rented-out capacity being offered well below market to win customers. Whether the cause is supply or demand, an imbalance shows up in price first. The moment a price signal appears, we go back and re-check the two lines above.
Every quarter we bring the actual data back and update the scorecard. When the signals change, we change with them.
This post used only a simple estimate for AI revenue. But one of the market's live arguments is exactly this: what level of AI revenue counts as good enough?
So in the next post we work out the expansion sweet spot: when revenue has a chance to cross the cost line, and, backing into it from cost, how much AI revenue it takes to clear each GPU's operating and build-out cost curve. Once that is done, the market's revenue estimates and the cost structure behind them become much clearer, and you get a line to anchor on and a checkpoint to test every quarter.