
Circular Deals Map (Through Aug 17 2026; Ledger Cross-Checked Line by Line Twice, Plus Aug 11:12 News, CRWV/NBIS Q2 2026 Additions, and the Aug 17 NVDA × SB Energy Ohio Deal)
Circular Deals Map (Through Aug 17 2026; Ledger Cross-Checked Line by Line Twice, Plus Aug 11:12 News, CRWV/NBIS Q2 2026 Additions, and the Aug 17 NVDA × SB Energy Ohio Deal)#
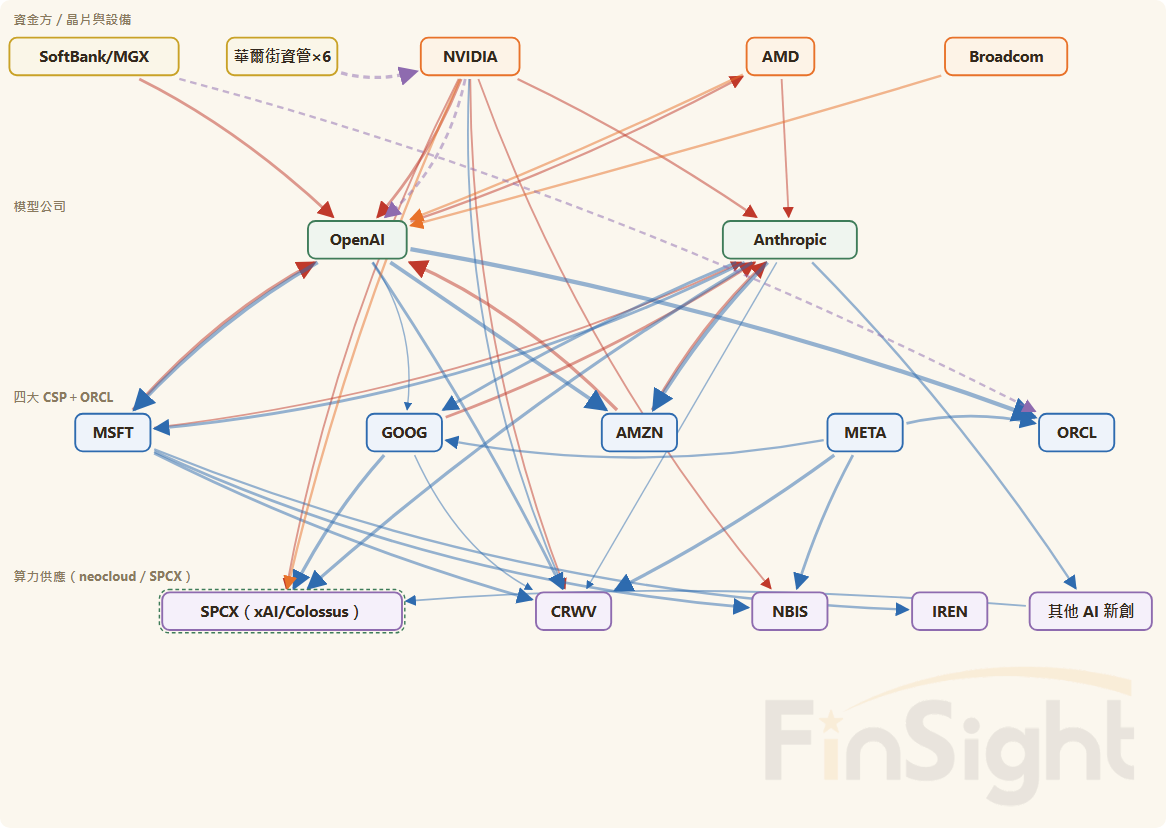
The circular deals map: equity stakes, compute purchases, chip supply and financing guarantees loop among the same group of companies, so money circulates inside the ring.Draft, pending review

Static image for now; interactive version coming.
How to read this chart
Line width roughly tracks deal size. Red is equity investment, blue is compute or cloud purchases (buyer to seller), orange is chip supply, purple dashed is financing or guarantees. NVDA's GPU sales to everyone are the baseline and are not drawn; only special supply relationships appear.
Source: FinSight compilation and estimates · Updated 2026-09-03
↩ This chart lives on the pagef3-circular-csp-01